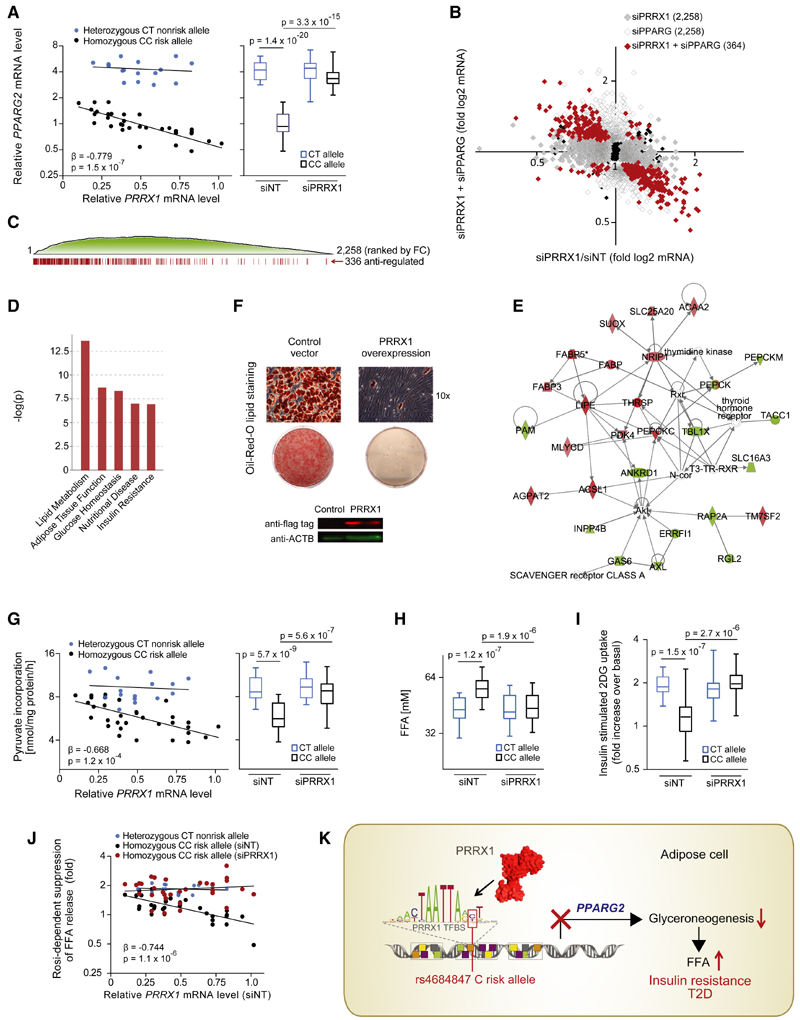
Figure 5. Binding of PRRX1 at the rs4684847 Risk Allele in Human Adipose Cells Affects Lipid Metabolism and Insulin Sensitivity.
(A) rs4684847-dependent PPARG2 and PRRX1 mRNA levels measured by qPCR (standardized to HPRT) in hASC from BMI-matched rs4684847 CT (n = 16) and CC (n = 32) risk allele carriers. siPRRX1 and siNT transfected concurrent with induction of adipogenic differentiation for 72 hr. Left: Pearson’s correlation in the siNT set. Right: box-whisker plot comparing PPARG2 mRNA in siNT- versus siPRRX1-treated cells (t test). FC, fold change.
(B and C) Global gene expression profiling by Illumina microarrays (q < 0.2) in hASCs from rs4684847 CC risk allele carriers transfected with siPRRX1 (n = 9, gray dots) and cotransfected with siPRRX1 and siPPARG (n = 4, red dots) for 72 hr after induction of adipogenic differentiation (B). Distribution of siPRRX1/siPPARG antiregulated genes among all regulated genes ranked by fold change (C).
(D and E) Biological pathways associated with siPRRX1/siPPARG antiregulated genes (D) and top scoring interaction network (E) from ingenuity pathway analysis.
(F) Oil Red O lipid staining of human SGBS cells with lentiviral-overexpressed flag-tagged PRRX1 (or control vector) 12 days after induction of adipocyte differentiation. Protein expression with aflag (PRRX1) and aACTB antibodies.
(G and H) rs4684847-dependent glyceroneogenesis rate measured by [1-14C]-pyruvate incorporation (G) and FFA release (H) in hASCs from BMI-matched rs4684847CT(n=16) and CC (n = 32) risk allele carriers aftersilencing ofPRRX1. (G) Left: Pearson’s correlation inthe siNT set. Right: box-whisker plot comparing siNT- versus siPRRX1-treated cells, t test. FFA, free fatty acids.
(I) rs4684847-dependent increase of [3H]-2-deoxyglucose ([3H]-2DG) uptake following insulin stimulation in hASCs. Box-whisker plot comparing siNT- versus siPRRX1-treated cells; t test.
(J) rs4684847-dependent rosiglitazone-mediated suppression of FFA-release during glyceroneogenesis. Pearson’s correlation comparing siNT versus siPRRX1. Mean ± SD, t test. See also Figures S4G and S4H; Tables 1 and 2.
(K) The rs4684847 risk allele (C allele) promotes PRRX1 binding 6.5 kb upstream of the PPARG2-specific promoter, leading to suppression of PPARG2 mRNA expression and perturbated lipid handling in adipose cells, increased circulating FFA levels, insulin resistance, and risk of T2D.

