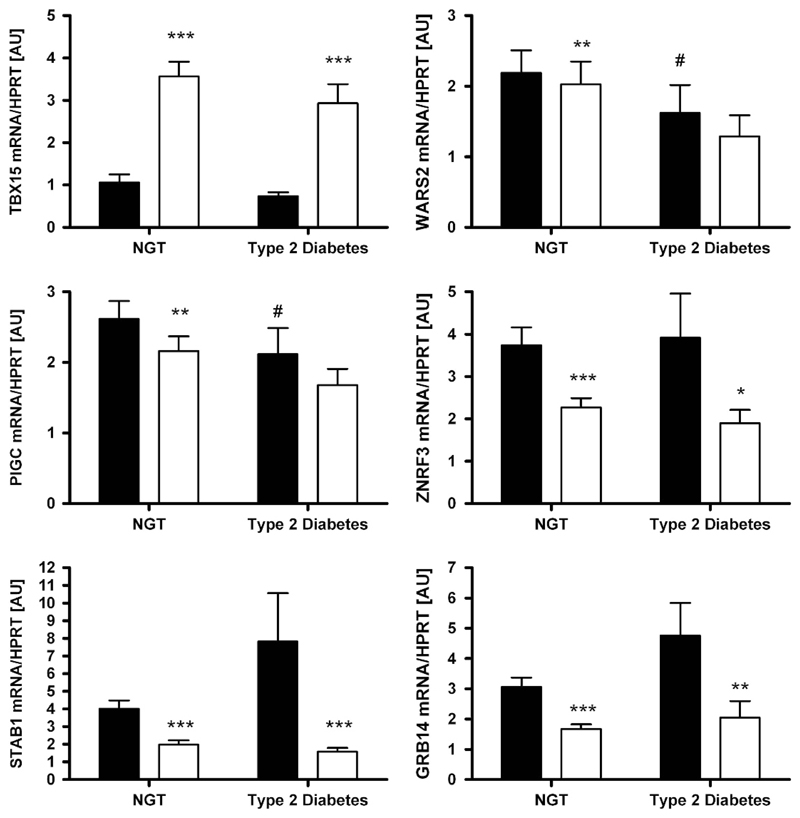
Figure 3.
Expression of TBX15, WARS2, PIGC, ZNRF3, STAB1 and GRB14 in paired human samples of visceral (vis) and subcutaneous (sc) adipose tissue (AT) grouped by type 2 diabetes status (NGT—subjects with normal glucose tolerance, N = 145; subjects with diabetes N = 71). Mean±s.e.m. Black bars represent vis and white bars sc AT. *vis vs sc AT depot; #vs NGT depot. *,#P < 0.05; **,##P < 0.01; ***/###P < 0.001.

