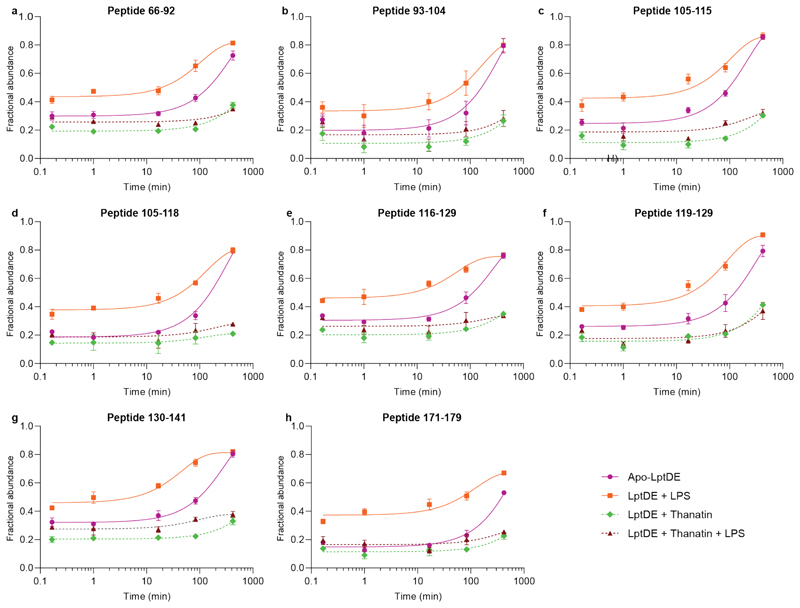
Extended Data Figure 5. Monoexponential fitting of the high-mass population in peptides showing EX1 kinetics.
Extracted relative abundances of high- mass populations plotted as a function of labelling time and fitted to a single exponential function with a variable intercept and plateau (to account for the lack of saturation seen in most peptides) to obtain the rate of translation from the low-mass population to the high-mass population (kop) and the half-life of the low mass population (t1/2). The apo state is indicated in purple, LPS-bound state in orange, thanatin-bound state in green, and LPS + thanatin state in maroon. Standard deviations are plotted as error bars (nbiological = 2; ntechnical = 3) but are in some instances too small to be visible. In the case of thanatin-bound state and LPS + thanatin state kinetic values could not be extracted because of poor fitting (the increase of high-mass population is incremental given the slow kinetics). In these cases, the dotted line is included only for visual guidance.

