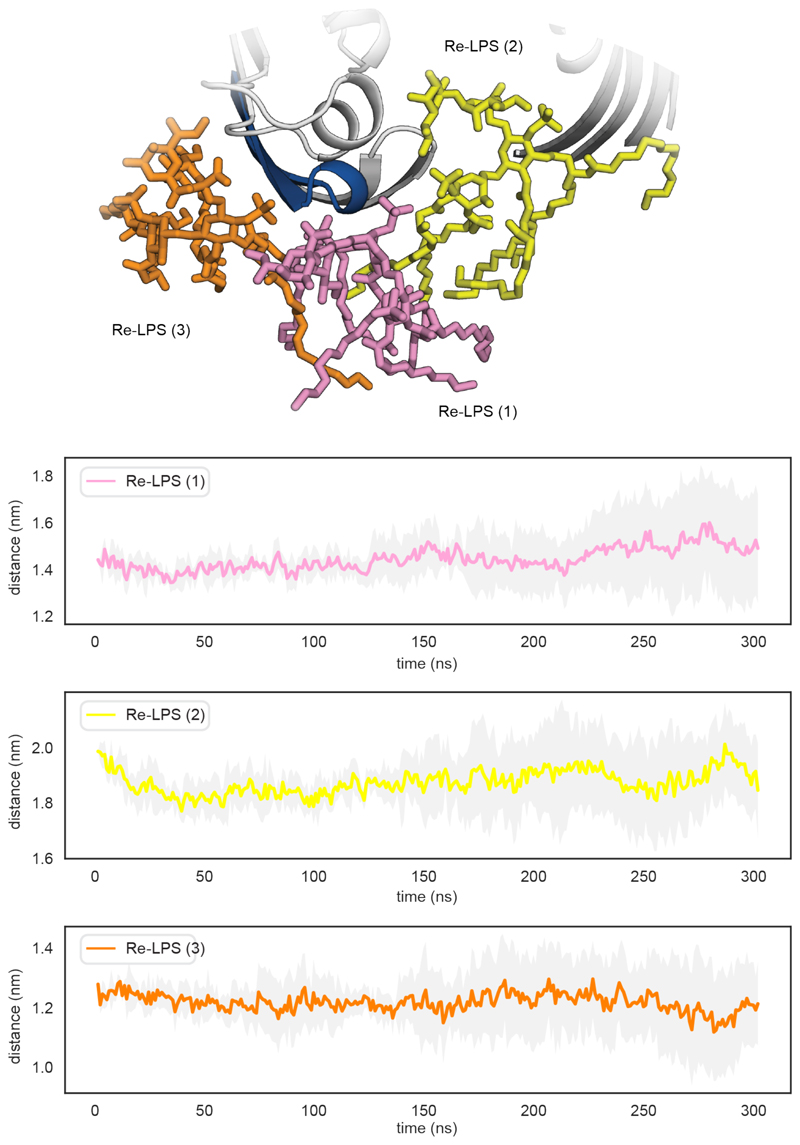
Extended Data Figure 8. Re-LPS distance plots.
Top: snapshot of the key lipid interactions between Re-LPS and the lateral gate peptide (232-251). Bottom: Plots measuring the distance from the geometric centre of the peptide (232-251) to the geometric centre of the lipids. Data plotted as the average of five repeats throughout the course of the simulation, standard deviation shaded grey.

