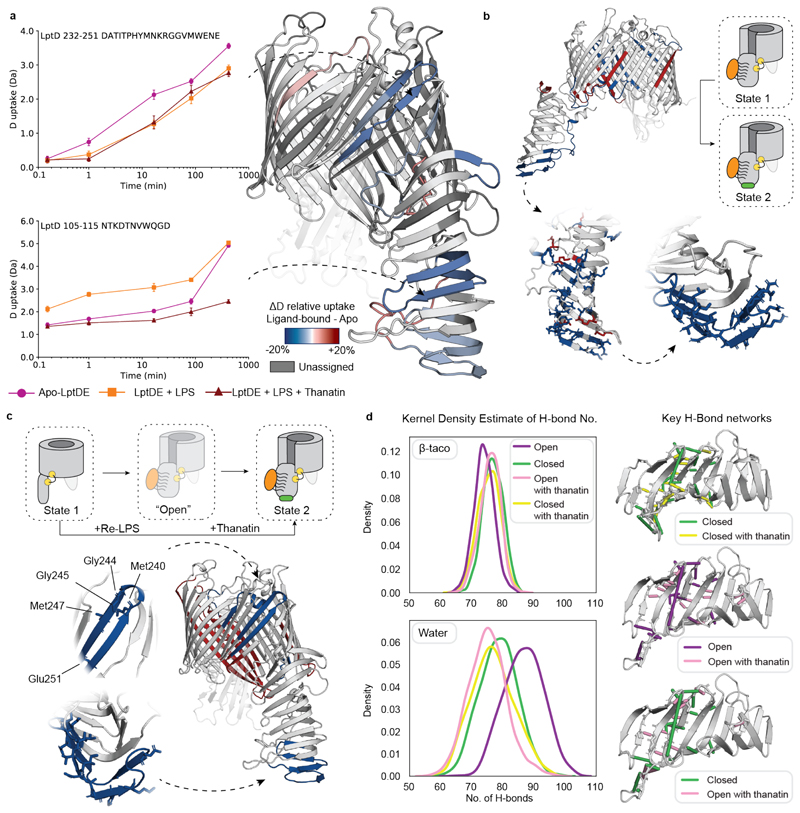
Figure 4. Conformational dynamics of LptDE in the presence of both LPS and thanatin.
(a) Left: the deuterium uptake of representative peptides (105-115, β-taco and 232-247, β-barrel) plotted as a function of labelling time for apo-LptDE (purple spheres) and LptDE in the presence of LPS (orange squares) or both LPS and thanatin (maroon triangles). Error bars indicate s.d. (nbiological = 2; ntechnical = 3). Right: difference in relative deuterium uptake (scaled for the number of residues of each peptide) at the 16.67 min labelling time mapped on the crystal structure of LptD. Only peptides showing significant difference are coloured. Red and blue indicate increased and decreased deuterium uptake, respectively. Detailed information of HDX-MS data is provided in Supplementary Table 2. (b) Top: differential solvent contact map between the open Re-LPS bound state with and without thanatin docked to the bottom of the β-taco. Bottom: comparison of the differential solvent map of the β-taco shown residue by residue (left) and averaged over experimentally determined peptides (right) where all significant residues are highlighted in a stick representation. (c) Top: cartoon schematic illustrating the comparison between the apo-closed state (1) and the open Re-LPS bound state (2) with thanatin docked. Bottom: HDX differential plot between states 1 and 2, with protected peptides highlighted on β-taco and β-barrel with significant residues labelled and shown as sticks. (d) Left: Kernel Density Estimate (KDE) distributions of H-bond frequency per frame of simulation for each state of the β-taco, considering the H-bond network on the β-taco itself (upper) and that which it makes with the solvent (lower). Right: H-bonds which are occupied more than 25% in one state compared to the other are shown, as indicated by the legends.

