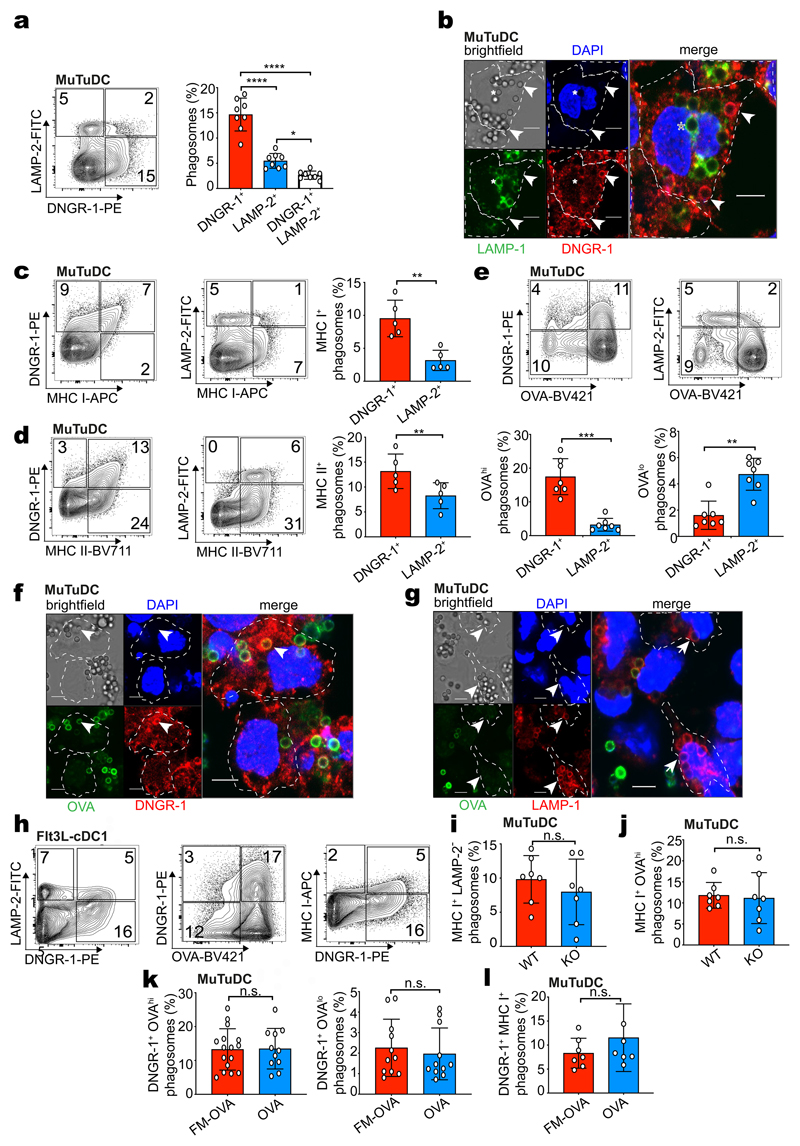
Figure 2. DNGR-1 marks an early MHC I+ non-degradative phagosome population.
a, WT MuTuDCs were pulsed with FM-OVA beads and incubated for 2 hrs. Phagosomes were isolated and stained with anti-DNGR-1 and anti-LAMP-2 antibodies and analysed by flow cytometry. Frequency of DNGR-1+, LAMP-2+ and DNGR-1+LAMP-2+ phagosomes is plotted as mean (± s.d.) from eight independent experiments (n = 8). P values were calculated by one-way ANOVA. b, WT MuTuDCs were pulsed with FM-OVA beads (5:1 beads to DCs, 15 mins). DNGR-1 (red) and LAMP-2 (green) cells were imaged by confocal microscopy (bar scales 5 μm, nucleus stained with DAPI). The arrow marks a DNGR-1+ phagosome and the asterisk marks a LAMP-1+ phagosome. Individual cells are outlined with dotted lines. Images are representative of two independent experiments (n = 2). c-e, WT MuTuDCs were pulsed with FM-OVA beads and incubated for 2 hrs. Phagosomes were isolated and stained with anti-DNGR-1, anti-LAMP-2 and anti-MHC I or anti-MHC II antibodies or anti-OVA and analysed by flow cytometry. Frequency of phagosomes with the indicated phenotype is plotted as mean ± SD from 6 (c, d) or 7 (e) independent experiments. P values were calculated by two-tailed t-test, Welch’s test. f, g, WT MuTuDCs were pulsed with FM-OVA beads (5 : 1 beads to DCs, 15 mins). (f) DNGR-1 (red) and LAMP-2 (green) or (g) LAMP-1 (red) and anti-OVA (green) cells were imaged by confocal microscopy (bar scales 5 μm, nucleus stained with DAPI). The arrows mark DNGR-1+OVAhi phagosomes (f) or LAMP-1+OVAlow phagosomes (g) Images are representative of 2 independent experiments. h, cDC1s purified from Flt3L bone marrow cultures were pulsed with FM-OVA beads and incubated for 4 hrs. Phagosomes were isolated and stained with anti-DNGR-1, anti-LAMP-2, anti-OVA and anti-MHC I antibodies and analysed by flow cytometry. i, j, WT and DNGR-1-deficient (KO) MuTuDCs were pulsed with FM-OVA beads and incubated for 2 hrs. Phagosomes were isolated and stained with anti-LAMP-1 or anti-OVA and anti-MHC I antibodies and analysed by flow cytometry. Frequency of MHC I+LAMP-2– phagosomes or MHC I+OVAhi phagosomes is plotted from seven independent experiments. P values were calculated by an unpaired nonparametric test, Kolmogorov-Smirnov test. k, l, WT MuTuDCs were pulsed with FM-OVA or OVA beads and incubated for 2 hrs. Phagosomes were isolated and stained with anti-DNGR-1 and anti-OVA or anti MHC I antibodies and analysed by flow cytometry. Frequency of DNGR-1+ OVAhi and DNGR-1+OVAlow or DNGR-1+ MHC I+ phagosomes is plotted as mean (± s.d.) from seven independent experiments (n = 7). P values were calculated by an unpaired nonparametric test, Kolmogorov-Smirnov test. n.s., not significant; *P ≤ 0.05; **P ≤ 0.01; ***P ≤ 0.001; ****P ≤ 0.00001.

