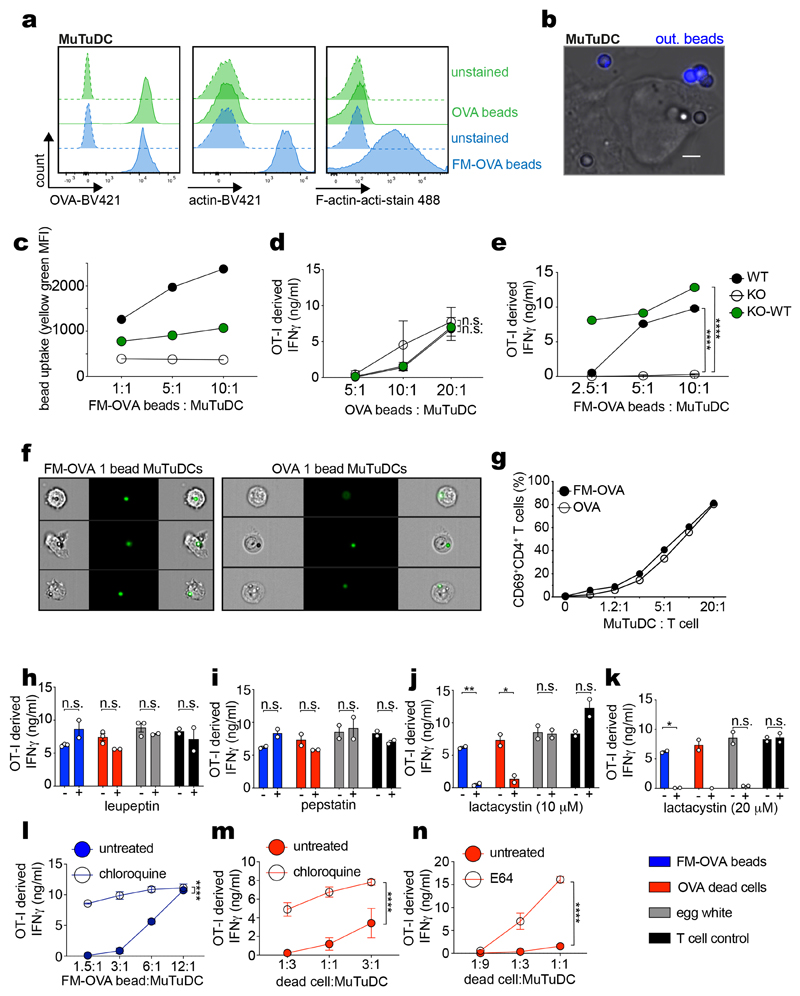
Extended Data Fig. 1. Bead uptake, CD4+ T cell stimulation and DNGR-1 mediated XP by the cytosolic pathway.
a, OVA and FM-OVA beads stained with anti-ovalbumin, anti-actin or phalloidin analysed by flow cytometry. b, WT MuTuDCs were pulsed with OVA or FM-OVA beads, fixed, stained with anti-OVA to mark uninternalized beads (“out. beads”) and imaged by confocal microscopy (scale bar 5 μm). Image representative of one experiment. c, FM-OVA bead internalisation by WT, KO and KO-WT MuTuDCs analysed by flow cytometry. MFI from one of two experiments (n = 2). d-e, WT, KO and KO-WT MuTuDCs pulsed with OVA or FM-OVA beads for 4 hrs were co-cultured with OT-I cells. IFN-γ was assessed by ELISA. One of three experiments is shown. Plotted as mean (±s.d.) of experimental duplicates. P values determined using two-way ANOVA. f, ImageStream analysis of WT MuTuDCs pulsed with yellow-green FM-OVA or OVA beads for 4 hrs and sorted for single bead+ MuTuDCs. g, Single bead+ WT MuTuDCs were co-cultured with OT-II cells. CD69+CD4+ T cell frequency was determined by flow cytometry. One of three experiments is shown (n = 3). h-n, WT MuTuDCs were incubated with FM-OVA beads (blue, 10:1, beads:DCs), UV-irradiated bm1 OVA MEFs (red, 3:1, dead cells:DCs) or hen egg white (grey, 1 mg/ml) in the presence of 250μM leupeptin, 250 μM pepstatin, 10 μM lactacystin, 20 μM lactacystin, 50 μM chloroquine or 500 μM E64. After 4 hrs, OT-I cells were added overnight. OT-I cells alone were also incubated with SIINFEKL peptide (black, 1 nM) in the presence of the inhibitors. IFN-γ was assessed by ELISA, plotted as mean (±s.d.) of experimental duplicates and representative of two independent experiments (n =2). P values determined using an unpaired t test. n.s., not significant; *P ≤ 0.05; **P ≤ 0.01; ****P ≤ 0.00001.

