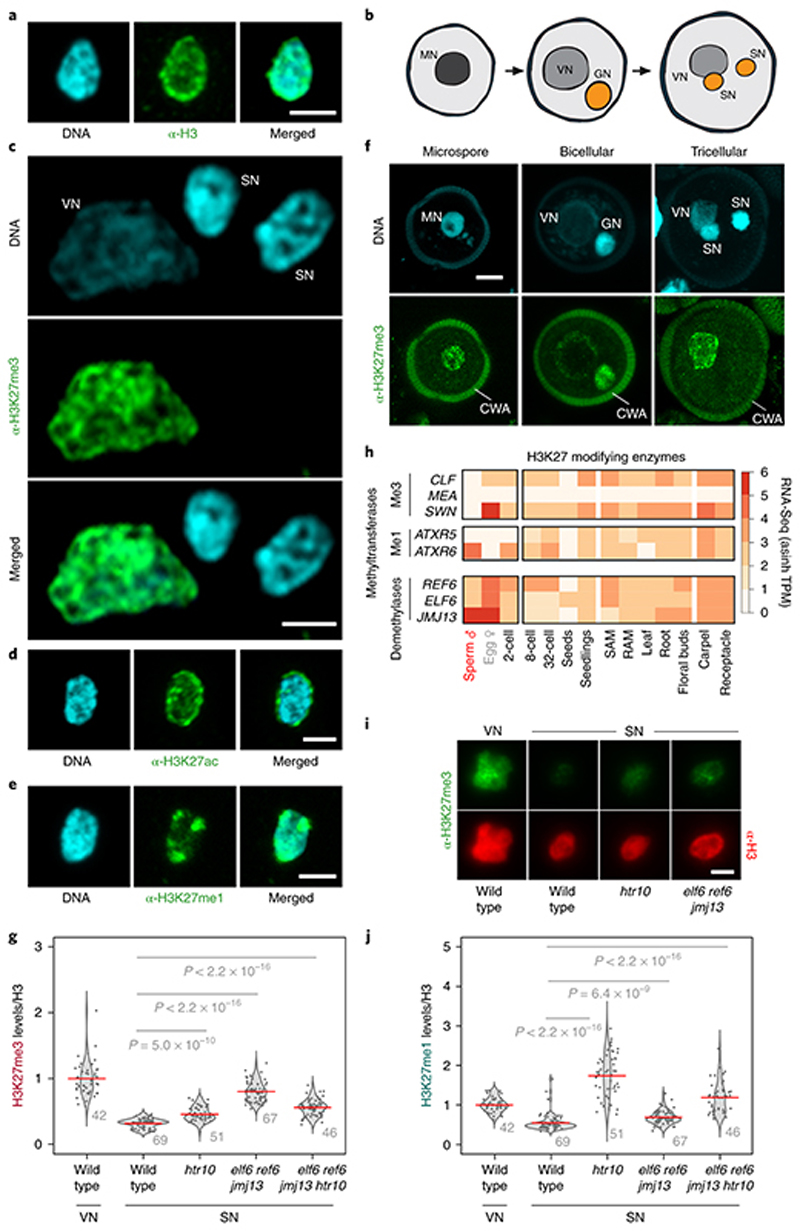
Fig. 1. H3K27me3 marks are globally lost from Arabidopsis sperm chromatin.
a, H3 antibody (α-H3) and 4′,6-diamidino-2-phenylindole (DAPI) staining of Arabidopsis sperm nuclei. Scale, 2 μm. b, Schematic of Arabidopsis pollen development. Microspore nuclei (MN) divide asymmetrically to produce a vegetative nucleus (VN) and germ cell nucleus (GN). The latter divides once again to produce two sperm nuclei (SN). c, α-H3K27me3 and DAPI staining of Arabidopsis vegetative cell nuclei (VN) and sperm nuclei (SN). Scale, 2 μm. The immunostain was repeated three times. d-e,α-H3K27ac (d) and α-H3K27me1 (e) immunostaining of Arabidopsis sperm nuclei alongside DAPI staining. Scale, 2 μm. f, Whole-mount α-H3K27me3 and DAPI staining of Arabidopsis pollen grains at different stages of development. Cell wall autofluorescence is indicated (cwa). Scale, 5 μm. The immunostaining in a and d-f was repeated twice. g, Quantification of α-H3K27me3 levels in VN and SN from WT, htr10, elf6;ref6;jmj13 and elf6;ref6;jmj13;htr10 pollennormalized to total H3 content. The violin curve represents the density of differing H3K27me3 levels. h, Expression of Arabidopsis histone H3 lysine 27 mono- (me1) and tri- (me3) methyltransferases (top two panels) and demethylases (third panel). Expression represents the inverse hyperbolic sine (asinh) transform of the mean RNA-seq TPM value sobtained from previously published datasets detailed in Supplementary Table 6. Sperm and egg were profiled with three and four RNA-seq biological replicates, respectively. i, α-H3K27me3 and α-H3 staining of VN and SN from wild type (WT), elf6;ref6;jmj13 and htr10 pollen. Scale, 2 μm. j, Quantification of α-H3K27me1 levels in VN and SN from WT, htr10,elf6;ref6;jmj13 and elf6;ref6;jmj13;htr10 pollen normalized to total H3 content. In g and j, red bar represents the mean of each genotype; quantification and statistical analysis were based on samples from one representative experiment; sample size (n = total number of nuclei) of each genotype is denoted alongside each violin plot. Statistical analysis was performed using a two-sided Mann-Whitney U-test. The experiment was repeated twice. Statistical source data are provided in Source Data fig. 1.

