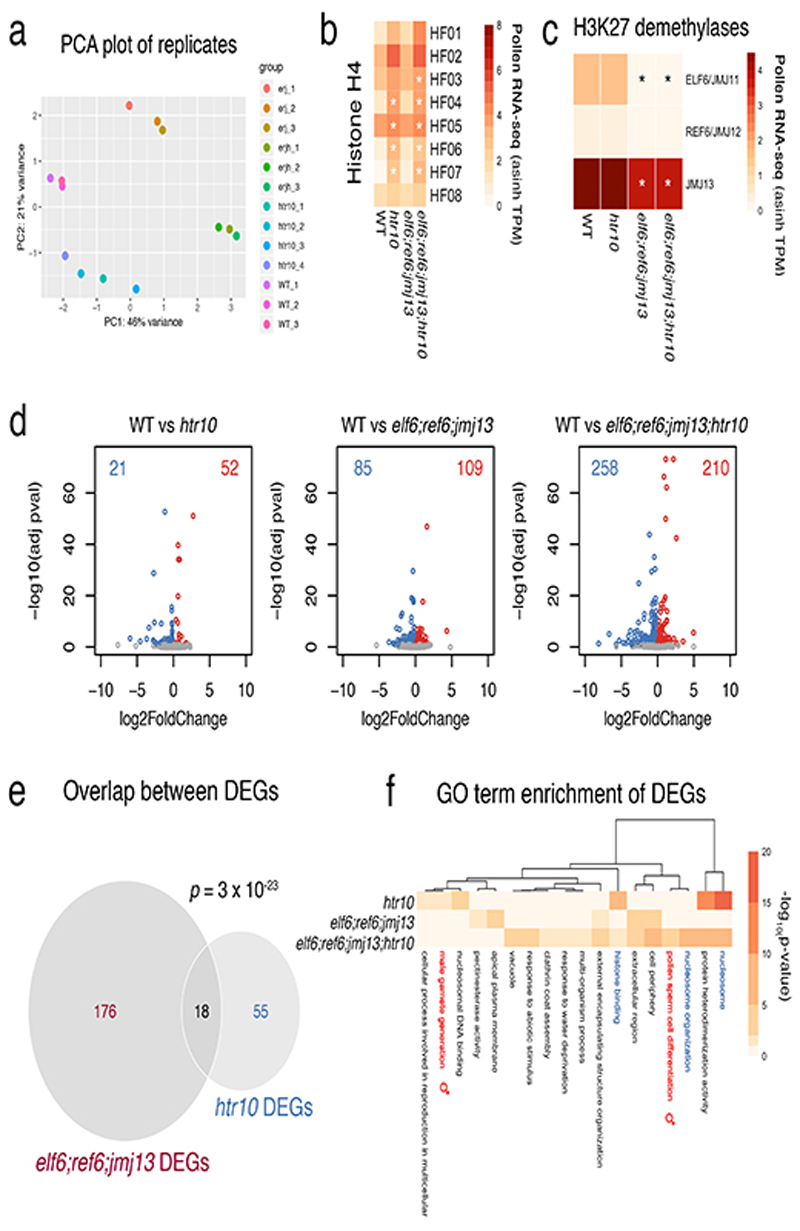
Extended Data Fig. 5.
Transcriptional profiling of htr10, elf6;ref6;jmj13 and elf6;ref6;jmj13;htr10 pollen.
a, Principal component analysis illustrating the high reproducibility of replicates and variation among the RNA-seq datasets generated from WT (n = 3 replicates), htr10(n = 4 replicates), elf6;ref6;jmj13 (n = 3 replicates) and elf6;ref6;jmj13;htr10(n = 3 replicates) pollen. All the biological replicates indicated (n) were used in the analysis that follows in panels b,c,d of this figure. b,c, Expression of (a) Arabidopsis histone H4 variants and (b) H3K27 demethylases in WT, elf6;ref6;jmj13, htr10 and elf6;ref6;jmj13;htr10 pollen. Expression represents the inverse hyperbolic sine (asinh) transform of the mean RNA-seq TPM values. The mean value of the biological replicates in a is shown, while the asterisks (*) indicate significantly different expression relative to WT pollen (p <0.001) using DESeq differential expression analysis and Benjamin-Hochberg correction to control for multiple comparisons. See source data for p-values. d, Volcano plots summarising significantly (adjusted p-value < 0.1) up-regulated (log2 FC > 0, red) and down-regulated (log2 FC < 0, blue) genes in htr10, elf6;ref6;jmj13 and elf6;ref6;jmj13;htr10 pollen relative to WT. DESeq analysis was used to determine differentially expressed genes from the biological replicates detailed in a and multiple comparisons controlled for using Benjamin-Hochberg correction. See Supplementary Table 3. e, Differentially-expressed genes (DEGs) in htr10(n = 73) and elf6;ref6;jmj13(n = 194) significantly overlap each other. Significance of the enriched overlap (p-value) was determined using a two-sided Fisher’s exact test. f, Clustered heatmap displaying enriched gene ontology (GO) terms associated with the DEGs in htr10(n = 73), elf6;ref6;jmj13(n = 194) and elf6;ref6;jmj13;htr10(n = 468) pollen relative to WT. Significant enrichment was assessed using g:Profiler and controlled for the multiple testing problem using the in-built g:SCS (sets counts and sizes) correction.

