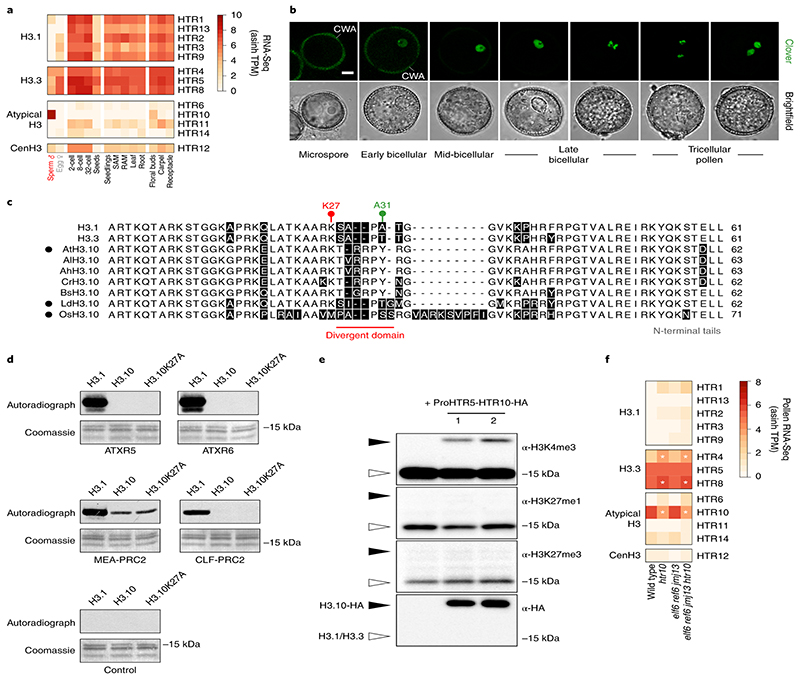
Fig. 2. Sperm-specific histone H3.10 is immune to K27 methylation.
a, Expression of Arabidopsis histone H3 variants. Expression represents the inverse hyperbolic sine (asinh) transform of the mean RNA-seq TPM values obtained from previously published datasets detailed in Supplementary Table 6. Sperm and egg were profiled with three and four biological replicates, respectively.. b, Expression of H3.10-Clover during pollen development. Cell wall autofluorescence is indicated (cwa). The experiment was repeated twice. Scale, 5 μm. c, N-terminal tail alignment of histone H3.1, H3.3 and H3.10-like variants from Arabidopsis thaliana (AtH3.10), Arabidopsis lyrata (AlH3.10), Arabidopsis halleri (AhH3.10), Capsella rubella (CrH3.10), Boechera stricta (BsH3.10), Lilium davidii (LdH3.10) and Oryza sativa (OsH3.10). Variants verified as sperm-specific in the literature are marked with a black dot. Black shading shows residue differences. The divergent domain and K27 are highlighted in red. Alanine 31 is highlighted in green. d, In vitro histone methyltransferase assays using recombinant H3.1 and H3.10 nucleosomes and Arabidopsis mono- (ATXR5/6) and tri- (MEA-PRC2 and CLF-PRC2) K27 methyltransferases. HMT assays with H3.10K27A nucleosomes confirm that residual MEA-PRC2 activity is non-specific to K27. The assay was performed once for ATXR5/6 and twice for PRC2. e, Western blot analysis of leaf histones isolated from two independent ProHTR5:HTR10-HA transgenic lines. No form of K27 methylation is detected on HA-tagged H3.10. This was not due to poor antibody affinity (Extended Data Fig. 2a-c) nor failure of the tagged variant to be modified in vivo, as indicated by the detection of H3K4me3. The experiment was repeated twice. f, Expression of Arabidopsis histone H3 variants in WT, htr10, elf6;ref6;jmj13 and elf6;ref6;jmj13;htr10 pollen. Expression represents the asinh transform of the mean RNA-seq TPM values of three biological replicates; four in the case of htr10. * indicates significantly different expression relative to WT pollen (p < 0.001) using DESeq differential expression analysis and Benjamin-Hochberg correction to control for multiple comparisons. See source data for precise p -values. Statistical source data and raw blots are provided in Source Data fig. 2.

