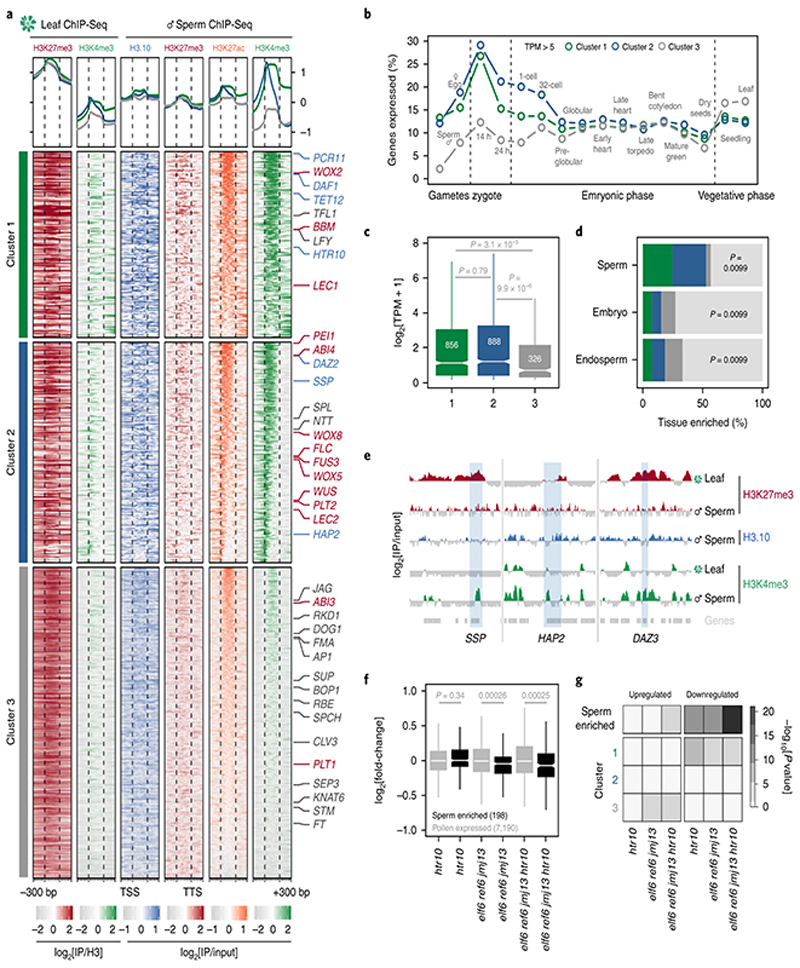
Fig. 4. Paternal resetting of H3K27me3 facilitates sperm specification.
a, Chromatin state of Polycomb-silenced genes in leaf and sperm clustered based on sperm H3K4me3. Number of genes is n=1,866 (cluster 1), 2,220 (cluster 2) and 3,105 (cluster 3). Sperm differentiation genes (blue), embryonic factors (red) and post-embryonic regulators (grey) are marked. b, Percentage of cluster 1, 2 and 3 genes expressed in gametes, embryos and vegetative tissues (TPM > 5). TPM represents the mean obtained from previously published datasets detailed in Supplementary Table 6. Sperm and egg were profiled with three and four biological replicates, respectively. c, Sperm transcript levels (log2 RNA-seq TPM)for genes expressed from each cluster. Sample size (n= genes with TPM > 0.1)is denoted on each boxplot, which indicates minimum and maximum values as well as 25th, 50th and 75th quartiles. Statistical analysis was performedusing a two-sided Mann-Whitney U-test. d, Percentage Polycomb targets among genes with enriched expression in sperm (n =463 genes), early embryos (n=279 genes) and early endosperm (n =463 genes)with colours corresponding to the clusters defined in panel a. Statistics is based on a one-sided permutation test (n = 100 permutations) compared with random TAIR10 regions. e, ChIP-seq tracks of three sperm differentiation genes - SHORT SUSPENSOR (SSP), HAPLESS 2 (HAP2) and DUO1-ACTIVATED ZINC FINGER 3 (DAZ3). Coverage represents log2 ratio of IP relative to input. Coloured and grey shading indicate enriched or depleted signal, respectively. In panels a and e, ChIP-seq was performed with three biological replicates; two for sperm H3K27me3. f, Differential expression between htr10, elf6;ref6;jmj13 and elf6;ref6;jmj13;htr10 pollen relative to WT, with minimum and maximum values as well as 25th, 50th and 75th quartiles indicated. Sample size (n) of pollen-expressed (grey) and sperm-enriched genes (black) is shown. Statistical analysis was performed using two-sided Mann-Whitney U-tests. g, Overlap of differentially-expressed genes in htr10, elf6;ref6;jmj13 and elf6;ref6;jmj13;htr10 with sperm-enriched and cluster 1, 2, 3 genes. Statistical enrichment was determined using pairwise two-sided Fisher’s exact tests. Statistical source data including sample sizes (n) and precise p-values are provided in Source Data fig. 4.

