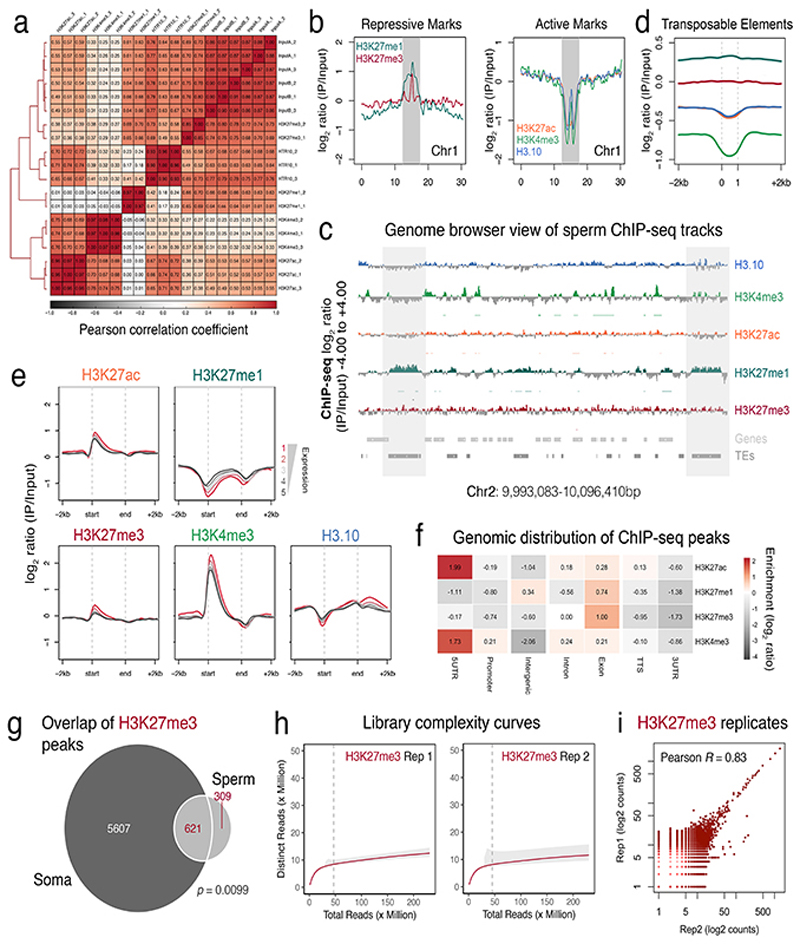
Extended Data Fig. 3.
Epigenomic profiling of Arabidopsis sperm chromatin.
a, Pearson correlation matrix of the ChIP-seq datasets generated in this study. Each ChIP-seq replicate is indicated in the matrix, which was performed with three biological replicates; two for H3K27me1 and H3K27me3. b, Distribution of repressive (top panel) and active marks (bottom panel) over Arabidopsis chromosome one. Plotted is the ChIP-seq log2 enrichment of IP DNA relative input calculated in 10kb bins. Pericentromeric heterochromatin is indicated with grey shading. c, Genome browser view of the sperm ChIP-seq datasets. Coverage is represented as the log2 ratio of IP DNA relative to input. Coloured and grey shading indicate an enriched or depleted signal, respectively. Genes (light grey) and transposable elements (dark grey) are shown below. d, Distribution of sperm histone marks over transposable elements. Plotted is the ChIP-seq log2 enrichment relative to input. e, Distribution of sperm histone marks over genes sorted by expression level in sperm. f, Genomic distribution of histone mark peaks in sperm. As expected, H3K27ac and H3K4me3 peaks were mostly enriched over the 5’UTR of genes. H3K27me1 and retained H3K27me3 peaks were mostly enriched over exons, while H3K27me1 peaks were also enriched in intergenic regions. g, Overlap of the retained sperm H3K27me3 peaks with somatic H3K27me3 domains. Statistical analysis is based on a one-sided permutation overlap test (n = 100 permutations) compared with random TAIR10 regions. h, Estimated library complexity curves confirmed a sufficient sequencing depth for two independent biological replicates of sperm H3K27me3. The red curve represents the interpolated and extrapolated increase in complexity (i.e. distinct reads) with increased sequencing depth. The grey shading represents the upper and lower 95% confidence interval of the extrapolation. The dashed grey line represents the final sequencing depth of each sample. i, Plot of the pairwise correlation between sperm H3K27me3 biological replicates, which showed high reproducibility. Pearson’s correlation coefficient is shown.

