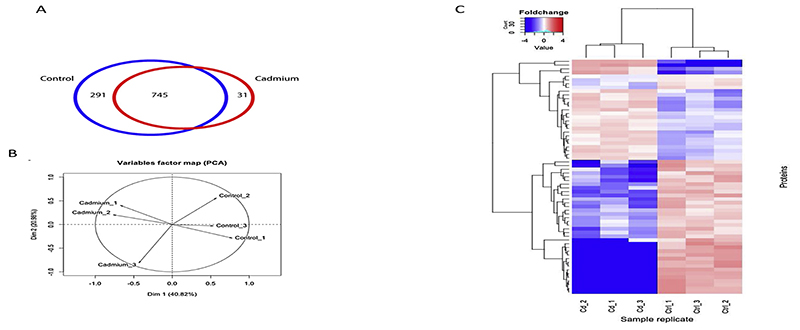
Fig. 1. The proteome of Anopheles gambiae larvae after multigenerational exposure to Cadmium metal.
Larvae proteins in Cd and control groups were extracted in triplicates, analyzed by 1D gel and tandem mass spectrometry. A) Venn plot shows the proportion of proteins found in both groups and those unique to each. B) principal component analysis of the replicate samples for Cd-tolerant vs. Control group C) Heatmap analysis of differentially expressed proteins. Log2 value of protein expression in (replicatemean) for each protein was calculated and 2tailed student t-test calculated in Cd-tolerant vs. Control. Protein with (BH corrected pvalue < 0.01) were used for generating heatmap in R Bioconductor heatmap.2 package.

