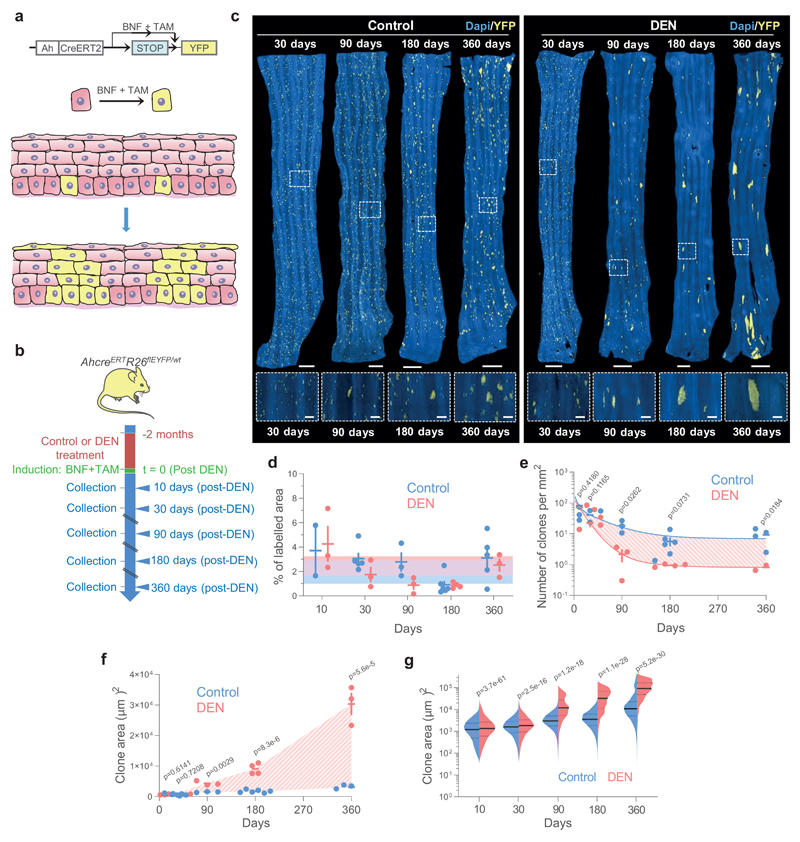
Figure 3. Lineage tracing reveals hallmarks of strong clonal competition in DEN-treated EE.
a, In vivo genetic lineage tracing using AhcreERTRosa26flEYFP/wt reporter mice.Cre-mediated excision of the stop codon by tamoxifen (TAM) and ß-napthoflavone (BNF) injection results in the heritable expression of yellow fluorescent protein (YFP), generating YFP-labelled clones. b, Protocol: AhcreERTRosa26flEYFP/wt mice were treated with DEN or vehicle control for 2 months, followed by clonal labelling. EE was collected at the indicated time points. c, Representative 3D-projected confocal images of control and DEN-treated EE collected at the indicated time points. Nuclear (DAPI) staining is blue and YFP-labelled clones are yellow. Insets are enlarged views of dashed areas. Scale-bars: main panels 1mm, insets 200μm. d, Percentage of EE area labelled. Shaded areas indicate mean and 95% confidence bounds across all time points. Each dot represents a mouse, error-bars correspond to mean ± SEM (see n numbers below). e-f, Number of clones per mm2 of EE (e) and average area of clones (f) in control and DEN-treated mice collected at the indicated time points. Shading indicates the difference between the fitted curves. Each dot represents a mouse. Error-bars: mean ± SEM (p values from two-sided Student’s t-test; see n numbers below). g, Violin plots depicting the distributions of individual clone areas in control and DEN-treated mice. Lines show median and quartiles. p values are from two-sided two-sample Kolmogorov-Smirnov test. Number of mice (clones) for d-g (control/DEN): 10d = 2/3 (11552/15092), 1m = 5/3 (15865/5682), 3m = 3/3 (4152/539), 6m = 6/4 (2474/281), 12m = 5/3 (3485/188). See Supplementary Table 6.

