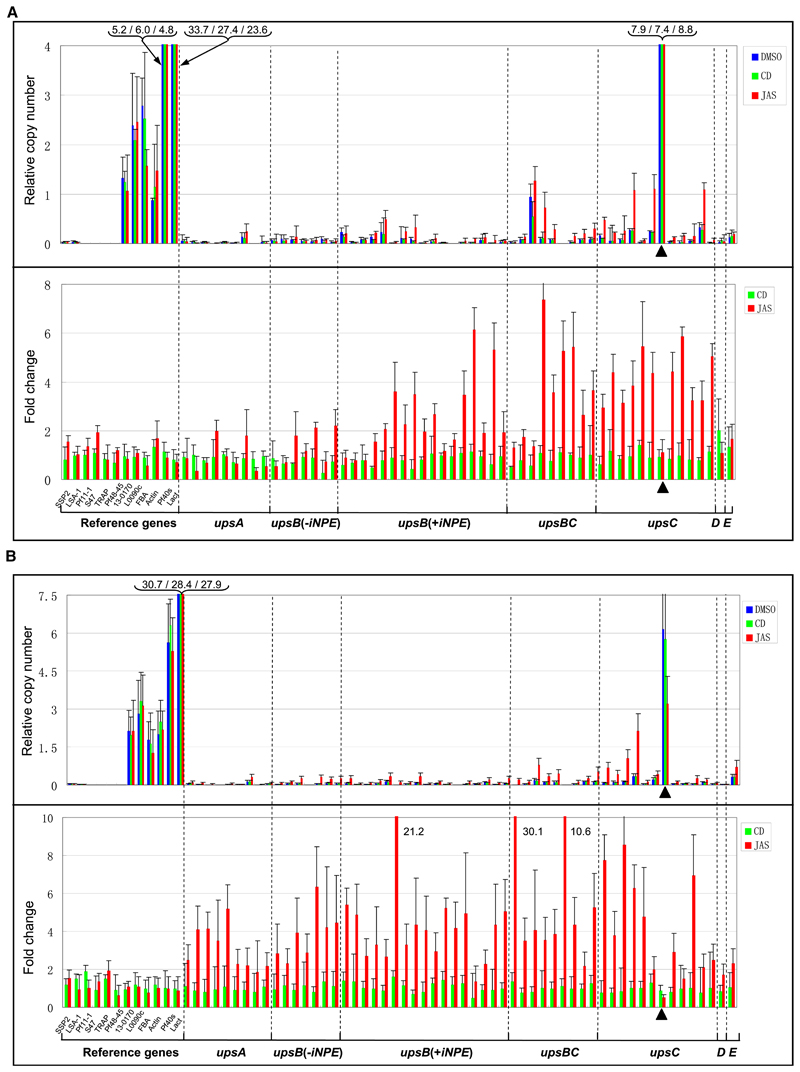
Figure 6. JAS Treatment Interferes with Mutually Exclusive var Gene Transcription.
(A) qRT-PCR analysis of the transcription level of individual var genes of 3D7 (G7 clone) after actin inhibitor treatment (Figure 5A, assay 1). The data are shown as relative copy numbers for all the three samples using the seryl-tRNA synthetase gene (PF07_0073) as endogenous control (upper panel) and the fold change of transcription level with respect to DMSO-treated sample (lower panel). Reference genes are the following: 1–6, transcriptionally silent in asexual blood stage; 7–12, transcriptionally active during asexual blood stage (see Tables S3 and S5). The dominantly expressed var gene before drug treatment (PFD0625c) in G7 clone is indicated with triangle.
(B) qRT-PCR analysis of transcription levels of individual var genes of 3D7 (G7 clone) treated with actin inhibitors for 3 hr and cultivated for 20 cycles in the absence of drugs (Figure 5A, assay 2). The data are treated and represented as in (A). Data of assays 1 and 2 are represented as mean ± SEM of two independent experiments.

