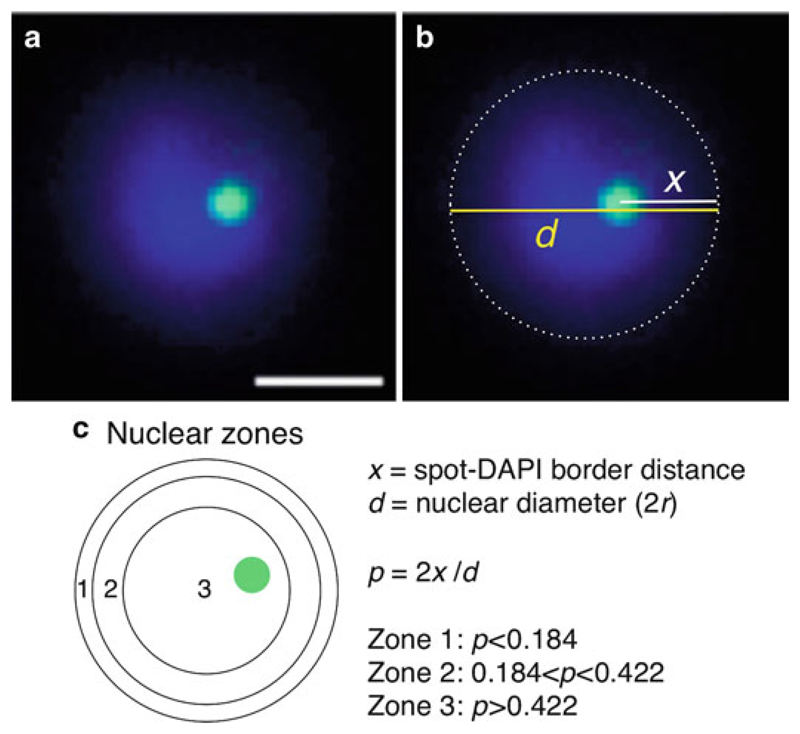
Fig. 4.
Subnuclear localization relative to the nuclear periphery. (a) DNA-FISH analysis of a single locus gene (PFB0540w, green) in ring-stage parasites. Nuclear DNA is visualized with DAPI (blue). Scale bar: 1 μm. (b) Schematic representation of the measurements of nuclear diameter (d, yellow line) and the distance of the green fluorescent spot to the nearest periphery (x, white line). The extremity of DAPI staining (defined by the low-intensity staining, see Note 26) represents the perimeter of the nucleus (dashed line). (c) Illustration of the three concentric zones of equal surface (zones 1, 2, and 3). As described in (15), the most peripheral zone (zone 1) corresponds to a ring of width 0.184 × nuclear radius (r). Zone 2 lies between 0.184r and 0.442r from the periphery, and zone 3 is a central core of radius 0.578r. In the example shown in a, p = 0.53, which falls in zone 3. Analysis of position is generally performed on 100–200 parasite nuclei, and the percentage of measured distribution is compared to a random distribution (33.3% in the 3 zones) or to another condition, using a chi-square test.

