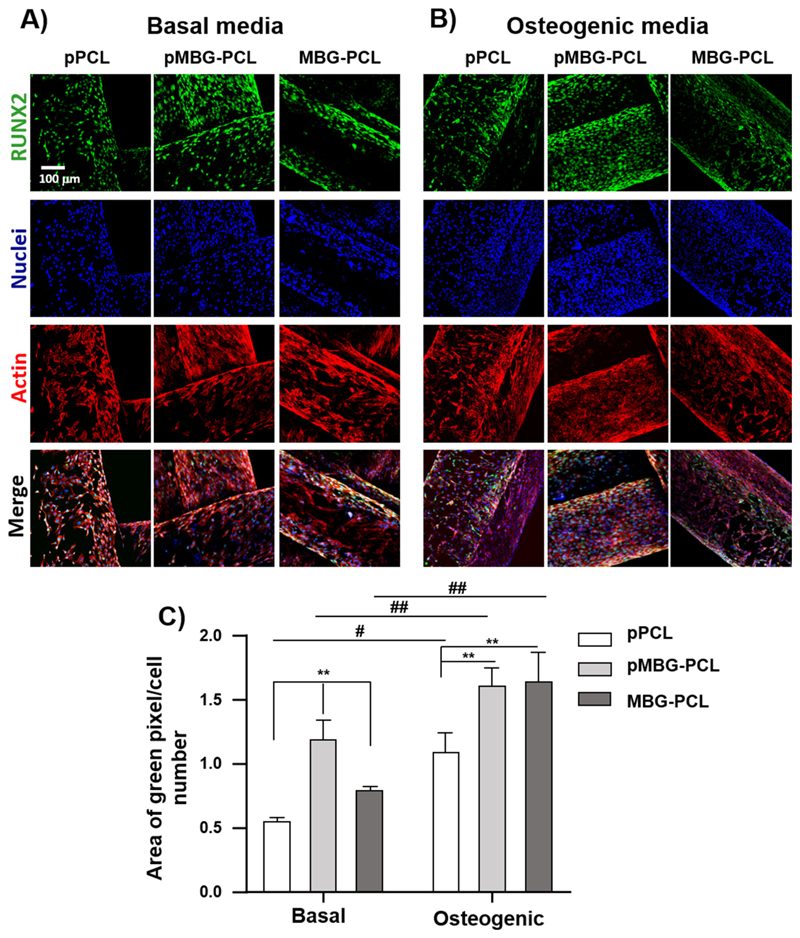
Fig. 10.
RUNX2 immunostaining images (green), nuclei (blue) and actin (red) of MC3T3-E1 on 3D printed scaffolds A) in basal media and B) in osteogenic media. C) Relative quantification of RUNX2 after 14 days of culture (n = 3). (** < 0.01 and * < 0.05 show statistical significance between the groups at the same media and ## < 0.01 and # < 0.05 show statistical significance between samples cultured in different media). (For interpretation of the references to colour in this figure legend, the reader is referred to the web version of this article.)

