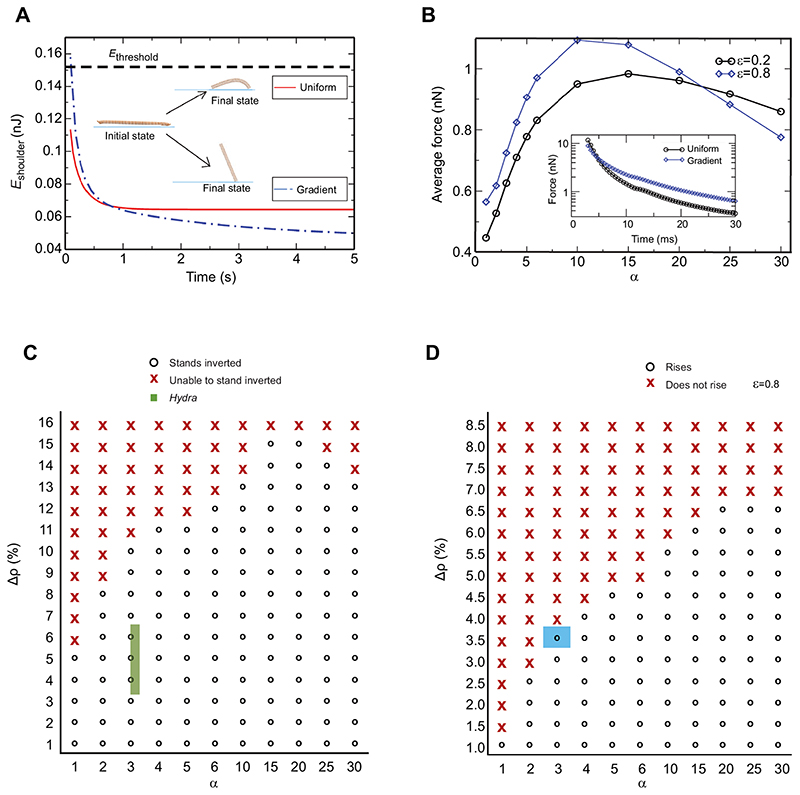
Fig. 5. Computer simulations unravel the significance of the differential in tissue stiffness for the somersault.
(A) Plot of the energy in the shoulder region E shoulder versus time after the end of a contraction for strain ε=0.8. E threshold is the calculated minimum energy required to overcome gravity and viscous drag. At the end of a contraction, E shoulder is higher than E threshold for α=3 (stiffness differential seen in AFM experiments) and less than E threshold for α=1 (uniform stiffness). The simulation snapshots of the cylinder show its initial and final positions for α=1 and α=3. (B) The plot of time-averaged longitudinal force on the 14th ring, which is at the junction of the stiff shoulder and rest of the body column, with respect to α after the release. The force on this ring peaks at an intermediate value of α and does not increase monotonically. This indicates that arbitrarily large values of α do not facilitate the optimal energy transfer. The inset shows force versus time for α=3 and α=1 before the contraction is complete at ~50-100 ms. Initially, the force is nearly the same in the two cases, but it becomes roughly double for α=3 at later times. (C) Phase diagram to describe the importance of tissue stiffness variation along the body column to overcome downward force on it due to a higher density of Hydra tissue compared with water. The region represented by crosses is the range of parameters for which model Hydra is unable to stand inverted after the release, and open circles represent the range for which it is able to stand inverted. The experimentally measured parameters of Hydra lie in the green rectangle in the phase space. The width and height of the rectangle represent experimental errors involved in estimating α and the mass density of Hydra, respectively. The initial strain ε is 0.8. (D) Phase diagram of the change in density (Δρ) and α with a Young’s modulus that is half of experimentally observed value. The uniform stiffness (α=1) enables Hydra to lift the body column having a density difference of only 1% compared with water. The blue square denotes the lower bound of density of real Hydra tissue and α=3. The plot underscores the importance of variation in stiffness even if it is overestimated in AFM measurements as a result of glutaraldehyde treatment. See also Table S3.

