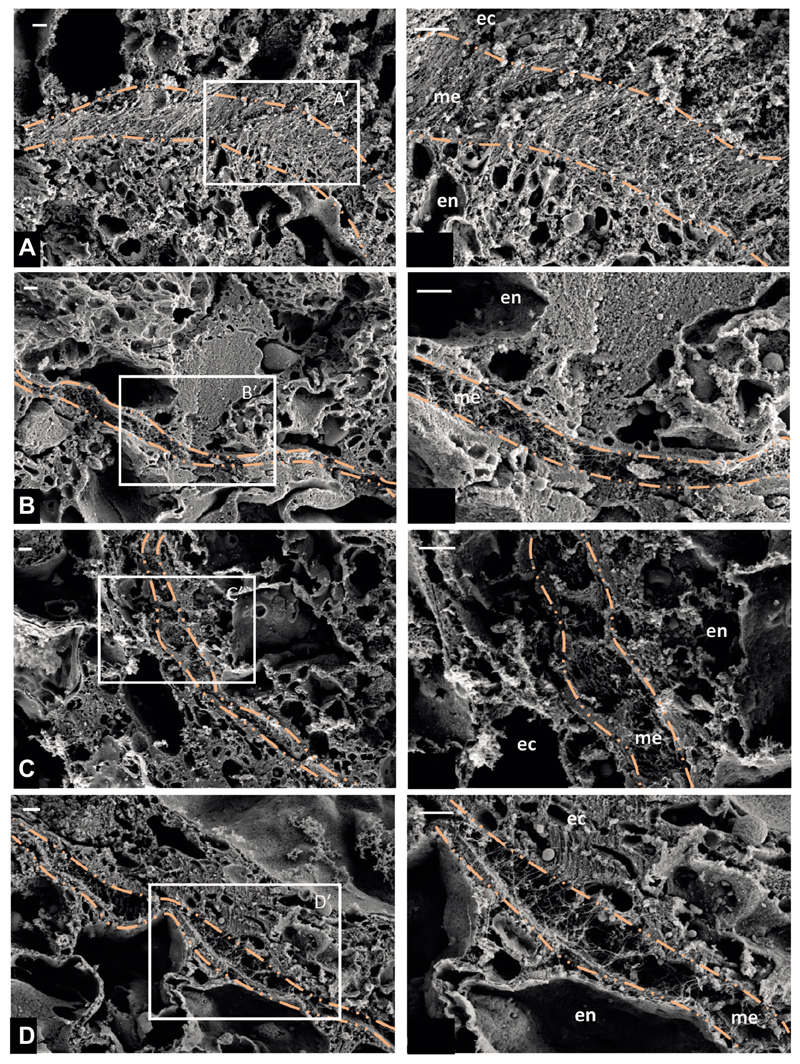
Fig. 7. Scanning electron micrographs (SEM) of Hydra mesoglea showing changes in the extracellular matrix between the shoulder region and body column following dipyridyl treatment.
(A,B) Control, (C,D) dipyridyl-treated polyps. (A) SEM of mesoglea (dash–dot orange line) from the shoulder region of the control polyp in transverse section (TS) showing dense collagen fibers. (B) SEM image of mesoglea (dash–dot orange line) from the body column region of the control polyp in TS showing less dense collagen fibers. (C) SEM image of mesoglea (dash–dot orange line) from the shoulder region of the polyp after dipyridyl treatment for 72 h in TS, showing loosely packed collagen fibers as a result of inhibition of collagen crosslinking. (D) SEM image of mesoglea (dash-dot orange line) from the body column region of the polyp after dipyridyl treatment for 72 h in TS, showing loosely packed collagen fibers as a result of inhibition of collagen crosslinking. For A–D, a higher magnification image of the boxed region is shown on the right. Scale bars: 1 μm. ec, ectoderm; en, endoderm; me, mesoglea.

