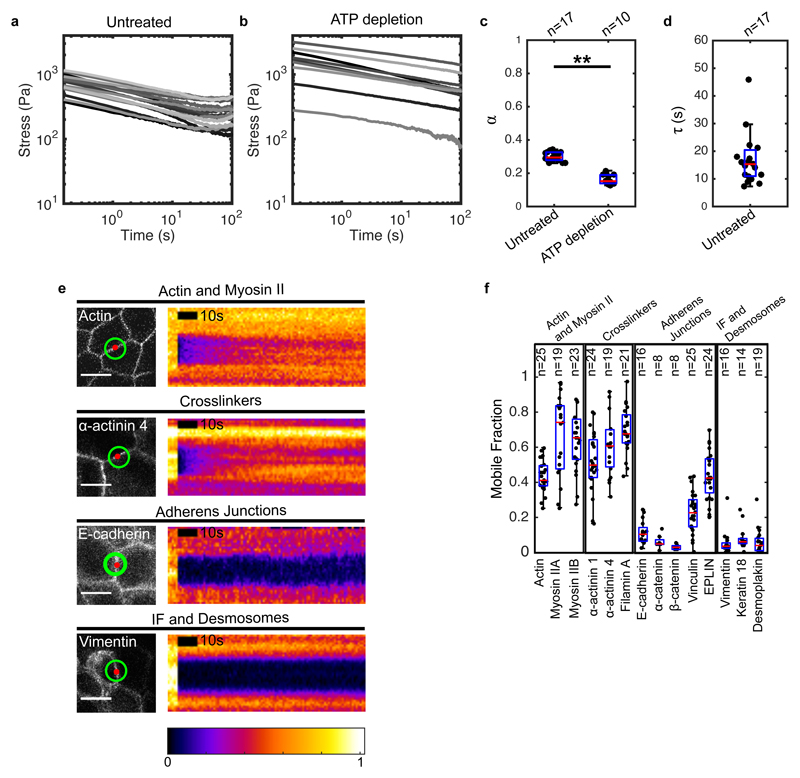
Figure 2. Significant cytoskeletal remodelling occurs over the timescale of stress relaxation.
(a,b) Stress relaxation curves of untreated (a, n=17) and ATP depleted (b, n=10) monolayers plotted on a logarithmic scale. (c) Boxplots comparing the power law exponent α of untreated and ATP-depleted monolayers. (** p < 0.01) (d) Boxplot of the exponential time constant τ for untreated monolayers. (e) Confocal microscopy images and kymographs of FRAP experiments. Left panels: the image shows localisation of the protein of interest, the red circle shows the bleached region, and the green circle shows the region imaged for fluorescence recovery. Right panels: each kymograph shows the normalised fluorescence intensity across the junction within the green circle. Intensities are normalised to the maximum intensity in each kymograph. (Scale bar: 10 μm) (f) Mobile fractions obtained from the FRAP curves for the cytoskeletal, adhesive, and junctional proteins examined. In all boxplots, the number of cells or monolayers examined is indicated above the graph.

