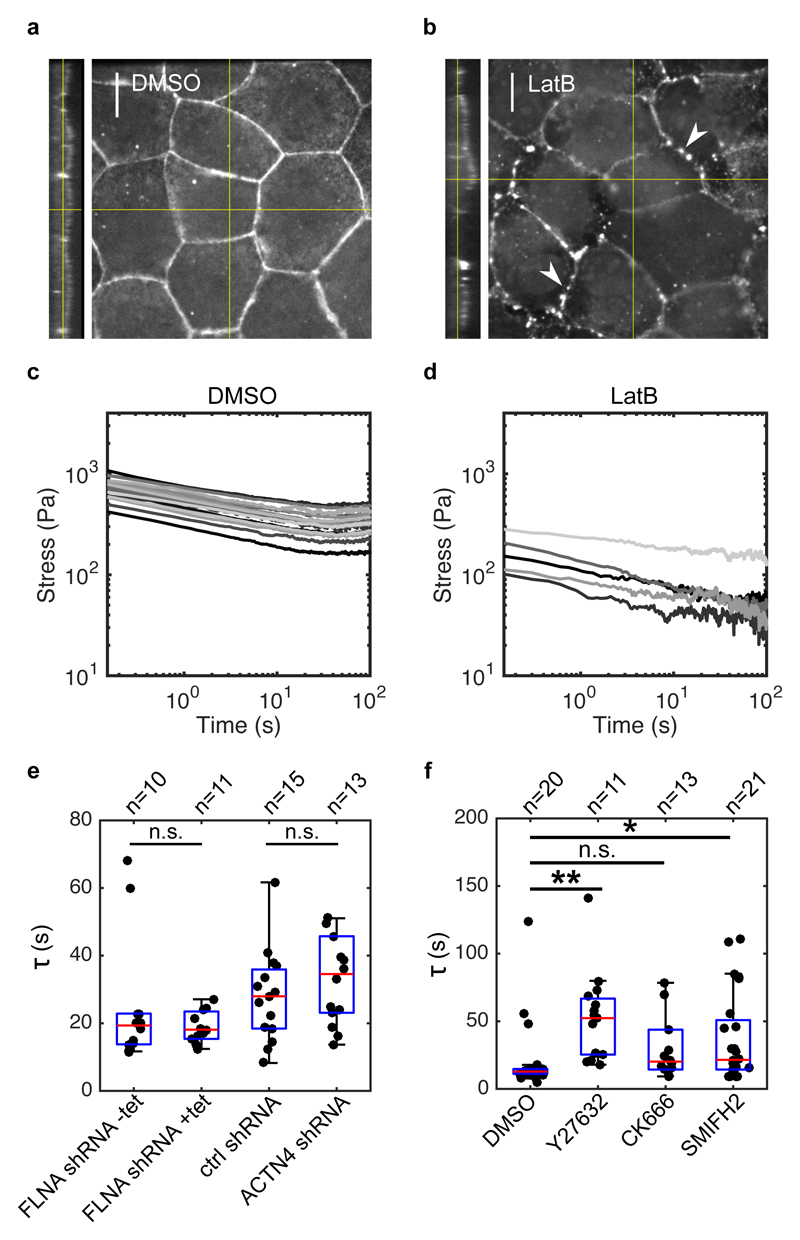
Figure 3. Monolayer stress relaxation is slowed by perturbations to actomyosin.
(a,b) Confocal microscopy images showing F-actin distribution in monolayers treated with DMSO and latrunculin B for 1 h. Junctional actin localisation was perturbed following latrunculin treatment, leaving puncta of actin at the junctions (white arrows). (Scale bar: 10 μm). The monolayer yz-profile is shown on the left hand side of the xy panel. (c,d) Stress relaxation curves of monolayers treated with DMSO and latrunculin B for 1 h displayed in a logarithmic scale. (e) Boxplots comparing the exponential time constant τ in monolayers depleted for actin crosslinkers Filamin A and α-actinin 4 (p = 0.34 for FLNA shRNA +tet and p = 0.40 for ACTN4 shRNA, compared to their respective controls). (f) Boxplots comparing the exponential time constant τ following treatments with DMSO, Y27632, CK666 and SMIFH2 (** p < 0.01 for Y27632, n.s. p < 0.05 with 75% statistical power for CK666, and * p < 0.05 for SMIFH2, all compared to DMSO). In all boxplots, the number of monolayers examined is indicated above the graph.

