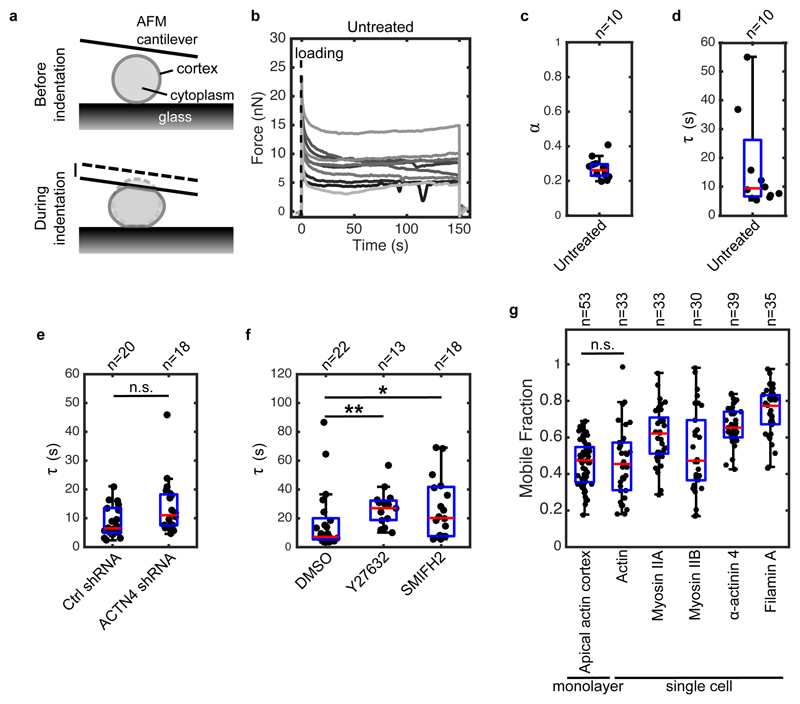
Figure 4. The dynamics of stress relaxation and the extent of actomyosin turnover are similar in single cells and monolayers.
(a) Diagram representing the experimental setup. At time t = 0 s, a single rounded cell is compressed between the glass surface and a tipless AFM cantilever. Cell compression leads to stretching of the cortex at the cell free boundaries. The evolution of force over time is measured by monitoring changes in cantilever deflection with an optical lever. (b) Temporal evolution of force in single rounded cells. A step deformation representing ~30% of cell height was applied at t = 0 s and maintained constant for 150 s. Each individual trace corresponds to a different cell. (c-d) Boxplots reporting the power law exponent α and exponential time constant τ for untreated rounded cells. (e) Boxplots comparing the characteristic relaxation times for cells expressing non-silencing shRNA (Ctrl shRNA) and shRNA targeting α-actinin 4 (ACTN4 shRNA) (n.s. p < 0.05 with 51% statistical power). (f) Boxplots comparing the characteristic relaxation times for cells treated with DMSO, Y27632, and SMIFH2 (** p < 0.01 for Y27632 and * p < 0.05 for SMIFH2, both compared to DMSO). (g) Boxplots comparing the mobile fraction of actomyosin proteins in the cortex of rounded cells after 100 s recovery after photobleaching as well as actin turnover in the apical cortex of cells within monolayers. In all boxplots, the number of cells examined is indicated above the graph.

