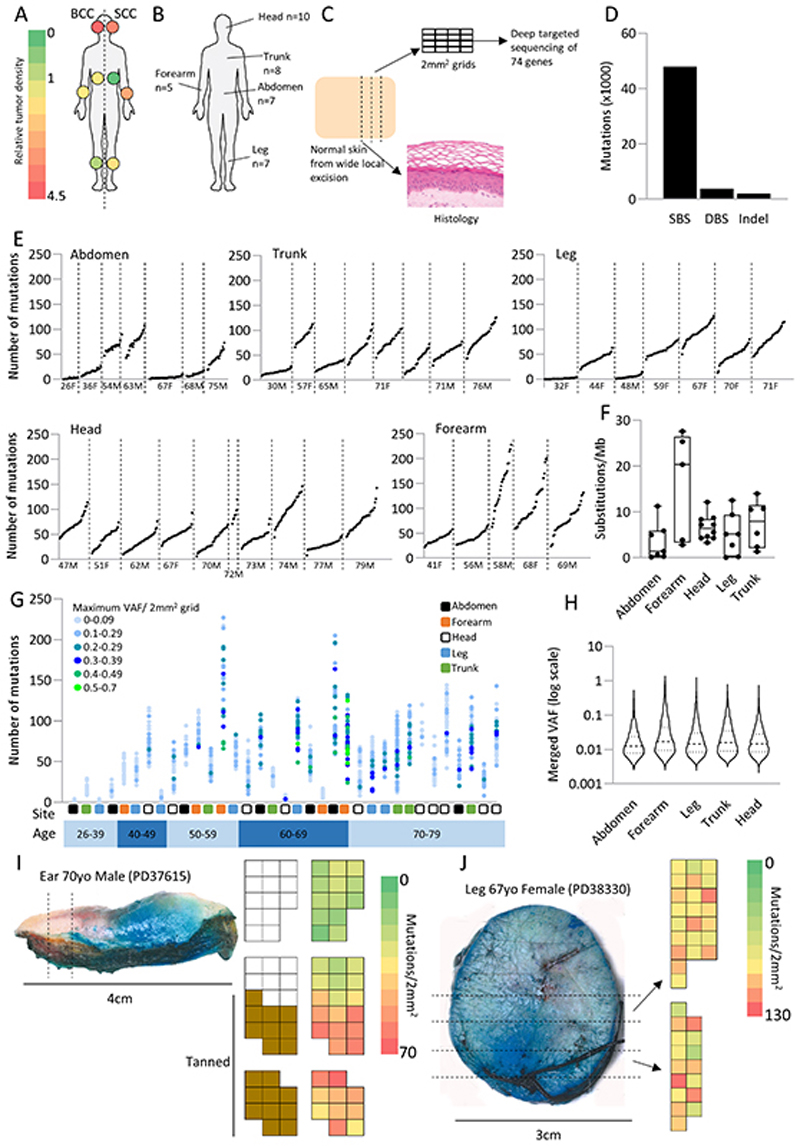
Figure 1. Human epidermis is a patchwork of small competing mutant clones.
a. Tumor density (cancers/unit area) for BCC and SCC across different body sites, whole body = 1.0. Data from (3).
b. Samples were collected from a variety of body sites with traditionally differing levels of sun exposure.
c. Experimental outline: Normal peeled epidermis was cut into 2mm2 grids and sequenced at high depth using a 74 gene panel bait set. Mutations were called using the ShearwaterML algorithm. A total of 35 patients were sequenced across 37 positions clustered into five main sites; abdomen, head, forearm, leg, and trunk. An average of 39 2mm2 grids were sequenced per position.
d. Total number of single base (SBS), double base (DBS) substitutions and insertion/deletion (indel) events across all 2mm2 grid samples from all body sites.
e. Number of mutations per 2mm2 grid from all 1261 samples from the 35 patients. Each point represents a single 2mm2 grid. Patients are ordered by age and divided by body site. M = male, F = female.
f. Average mutational burden (substitutions/Mb) per patient per site. Identical mutations in adjacent samples of a patient are merged (methods).
g. Distribution of the number of mutations and maximum variant allele frequency of all 2mm2 samples per patient. Each point represents a single 2mm2 sample and point colours represent the maximum variant allele frequency in that 2mm2 sample. Patients are ordered by age.
h. Variant allele frequency (VAF) distribution ordered by body site. Where adjacent grids share the same mutation this is assumed to be the same clone so the allele frequencies are summed as described in the methods.
i and j. Heatmaps showing the variation in the number of mutations across the epidermis. i shows an example, from a contiguous strip of skin divided into three blocks from an ear, where 2mm2 samples carrying a high number of mutations cluster together. This is not the case for the leg sample shown in j. In j the two blocks of samples are approximately 1cm apart. In i the increase in the number of mutations correlates with an increase in the pigmentation seen in the epithelia.

