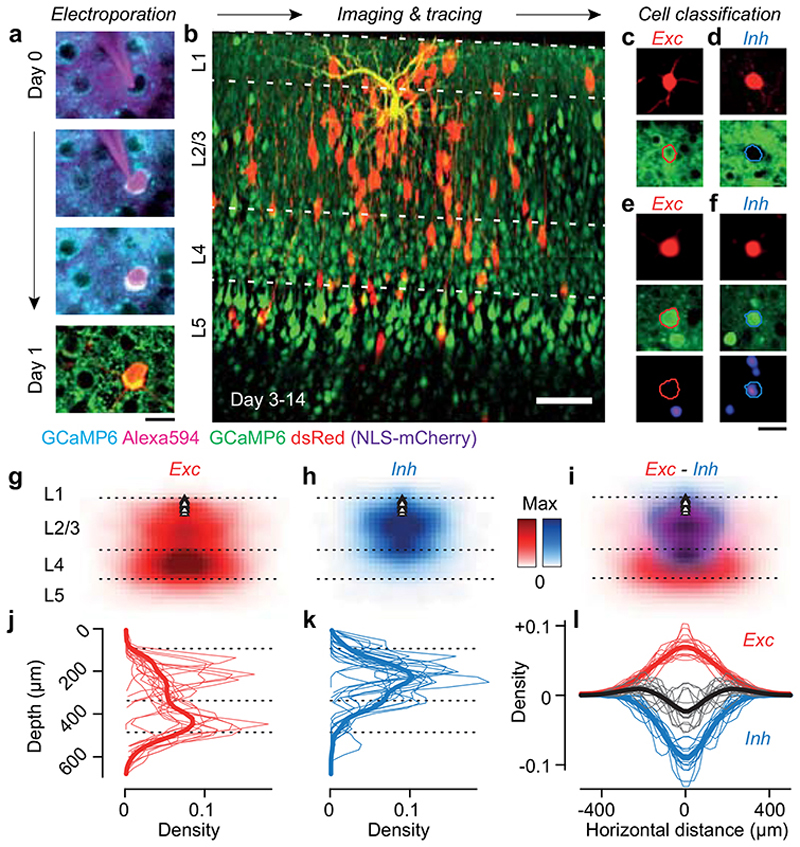
Figure 1. Tracing the excitatory and inhibitory presynaptic inputs to an L2/3 pyramidal neuron.
(a) Time-lapse of electroporation (Day 0) and dsRed expression (Day 1) of the postsynaptic neuron. Scale bar: 20 μm. (b) Montage of Z-stack sagittal projections (taken 3 and 14 days after rabies injection) showing the postsynaptic neuron (yellow), its presynaptic ensemble (marked by dsRed, red) and the excitatory population (expressing GCaMP6, green). Lines indicate cortical layers. Scale bar: 100 μm. (c,d) Examples of an excitatory (Exc, n = 584) and an inhibitory (Inh, n = 426) presynaptic neuron in a CaMK2a-GCaMP6 mouse (N = 13): expression of dsRed (top) provides a somatic outline matching the expression of GCaMP6 (bottom) for the excitatory neuron but not for the inhibitory neuron. (e,f) Examples of an excitatory (Exc, n = 373) and inhibitory (Inh, n = 117) presynaptic neurons (top) in a GAD-NLS-mCherry mouse (N=4) injected with AAV-Syn-GCaMP6 (middle), where nuclear mCherry (bottom) distinguishes inhibitory from excitatory neurons. Scale bar 25 μm (g) Max-normalised density of presynaptic excitation pooled across experiments (N=17 postsynaptic neurons, 1,500 presynaptic neurons). All postsynaptic neurons resided in upper L2/3 (black triangles). (h) Same as g, for inhibition. (i) Overlay of the maps of excitation and inhibition. Hue indicates relative proportion of excitatory (red) vs inhibitory (blue) inputs, and saturation indicates max-normalised neuronal density. (j,k) Depth distributions for excitatory and inhibitory presynaptic neurons, for individual experiments (thin curves), and pooled data (thick curve). Vertical scale as in g-i. (l) Same as j,k, for the radial distributions of excitatory (red) and inhibitory (blue) presynaptic neurons, and their difference (black). Horizontal scale as in g-i.

