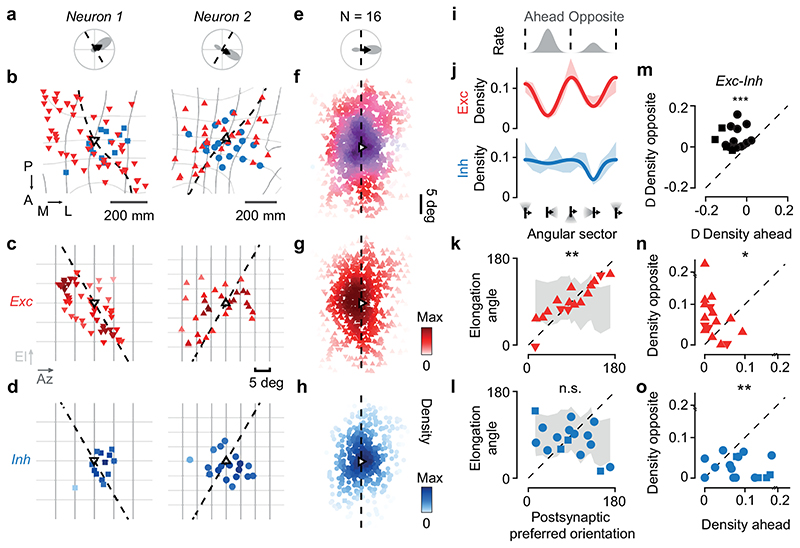
Figure 3. Elongated excitation and spatially offset inhibition accord with direction selectivity.
(a) Polar tuning curve of two postsynaptic neurons, showing preferred orientation (dashed) and direction (arrow). (b) Excitatory (red) and inhibitory (blue) presynaptic ensembles of postsynaptic neuron (open triangle, pointing in the preferred direction). The postsynaptic preferred orientation maps to a curve in cortex (dashed). Retinotopy is marked in 5 deg steps of azimuth (dark grey) and elevation (light grey). Coordinates: posterior (P), anterior (A), medial (M), lateral (L). (c) Excitatory presynaptic neurons in b replotted in visual space. Saturation indicates density. (d) Same as c, for inhibitory presynaptic neurons. (e) Average polar tuning curve across postsynaptic neurons, aligned to preferred direction (N= 16). (f) Excitatory and inhibitory presynaptic ensembles in visual space, pooled after alignment to the postsynaptic preferred direction (N=16). Hue indicates the relative proportion of excitation (red) vs. inhibition (blue); saturation indicates the average max-normalised density. (g) Same as f, for excitatory presynaptic neurons. (h) Same as f, for inhibitory presynaptic neurons. (i) Average postsynaptic tuning curve from e. (j) Angular density (shaded, mean ± s.e., N= 16) of excitatory (red) and inhibitory (blue) presynaptic neurons relative to the postsynaptic preferred direction. A sinusoid (capturing orientation selectivity) summed with a Gaussian (capturing direction selectivity) fit the data. (k) The angle of elongation of excitatory presynaptic ensemble correlates with the postsynaptic preferred orientation (r=0.72, pr = 7*10-3, circular correlation; pv = 10-4, circular V-test, N=16) significantly more than expected by chance (shaded area, median ± m.a.d., pr_rand = 10-3; pv_rand < 10-4). (l) Not so for the inhibitory presynaptic ensemble (r = -0.07, pr = 0.77; pv= 0.12). (m-o) Comparison of density in sectors opposite vs. ahead of the postsynaptic preferred direction for excitation (n, pw = 4*10-2, N= 16, two-sided Wilcoxon signed-rank test), inhibition (o, pw = 3*10-3) and difference between excitation and inhibition (m, pw = 4*10-4). In b-o, upward triangles and circles indicate CaMK2-GCaMP6 datasets; downward triangles and squares indicate GAD2-NLS-mCherry datasets.

