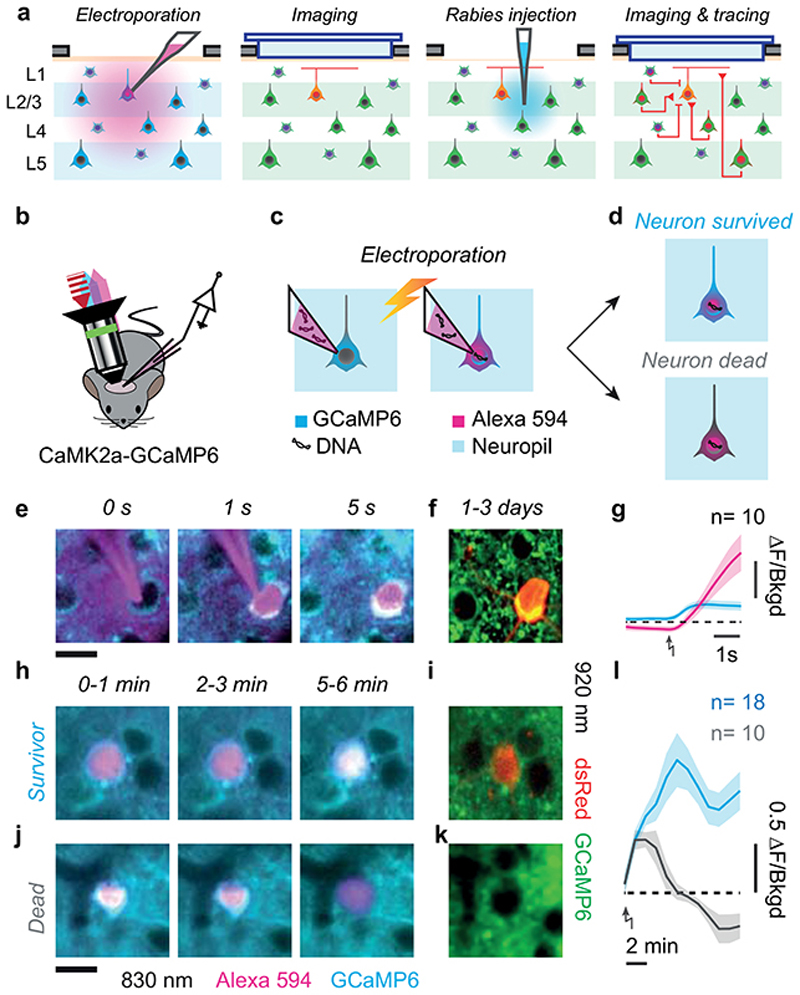
Extended Data Figure 1. Targeted single neuron electroporation with survival control in vivo.
(a) Experimental pipeline: electroporation of the postsynaptic neuron, targeted by shadow-imaging and expression of GCaMP6; imaging of the postsynaptic neuron, labelled by dsRed; injection of the modified rabies virus; imaging and tracing of the presynaptic neurons marked by dsRed. (b-d) Schematic of the electroporation technique, performed under a two-photon microscope on a transgenic mouse expressing GCaMP6 in cortical excitatory neurons. (b)A pipette filled with DNA plasmids and Alexa 594 is targeted to a craniotomy; an 820 nm laser (red) excites Alexa 594 fluorescence (magenta) and GCaMP6 fluorescence (cyan). The latter is insensitive to neural activity because 820 nm is an isosbestic wavelength, where calcium-bound and calcium-free isoforms fluoresce approximately equally. (c) Upon electroporation, DNA plasmids and Alexa594 are transferred into a neuron expressing GCaMP6. (d). A healthy neuron maintains its GCaMP6 concentration and the resulting calcium-insensitive fluorescence (top), while a neuron with a damaged membrane bleeds indicator, gradually darkening and disappearing against the surrounding neuropil (bottom). (e) Time-lapse of an electroporation in layer 2/3 of mouse V1, using Alexa 594 negative contrast and calcium insensitive GCaMP6 fluorescence imaging: approach (left), electroporation (middle), pipette withdrawal (right). Scale bar 15 μm (f) The same neuron, imaged the next day at 920 nm, expressing the electroporated genes for dsRed (red) and maintaining healthy GCaMP6 expression (green). (g) Average fluorescence (mean ± s.e.m.) of somatic Alexa 594 (magenta) and GCaMP6 (cyan) relative to neuropil background (dashed line represents unity) before and after electroporation (arrow, n = 10 neurons). (h,i) Same as e,f, with a slower time-lapse of a neuron that survived the procedure. Images in h are 30 s long averages acquired 0-1 min (left), 2-3 min (centre) and 5-6 min (right) after electroporation. (j,k) Same as h,i, for a neuron that did not recover from the electroporation. (l) Same as g, for GCaMP6 somatic fluorescence (mean ± s.e.m.) in neurons that did (cyan, n=18) or did not (grey, n=10) survive the procedure. Scale bar 15 μm, same for all fluorescence images.

