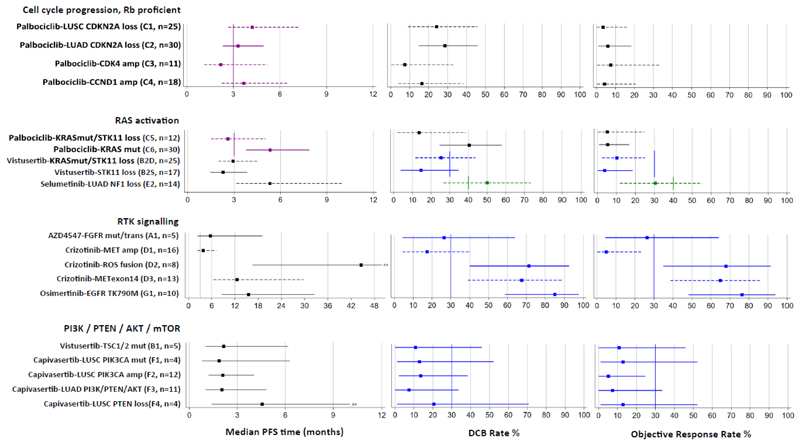
Fig. 3. Estimates of primary outcome measures for 19 drug-biomarker cohorts in NLMT grouped according to 4 modules of genomic aberrations.
Forest plots show Bayesian estimates and 95% credible intervals for true values of median PFS, DCB rate and OR rate. Purple is used to highlight estimates for which PFS is the primary outcome measure, with vertical lines showing a pre-specified clinically relevant target of a median PFS of 3 months. Green or blue is used to highlight estimates for which DCB and OR rates are co-primary outcome measures, with vertical lines showing pre-specified clinically relevant target rates of 40% or 30% respectively. Cohorts that are closed to recruitment are represented by solid lines and those still open are represented by dashed lines. Bayesian estimates are the medians of the posterior probability distributions derived from the current data and minimally informative priors. Because the trial is ongoing and the follow-up is not complete (including in some closed cohorts), these estimates are subject to change as the trial continues.

