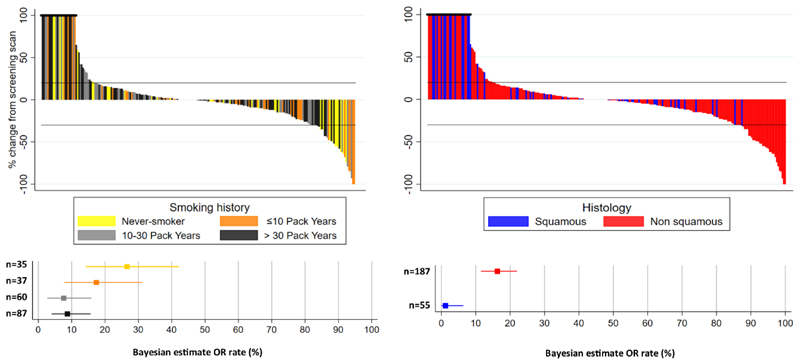
Fig. 4. OR rates and best percentage change in sum of target lesion diameters across 19 reported cohorts in NLMT according to smoking history and histology.
a, Top, waterfall plot shows, for each patient, the best percentage change in sum of target lesion diameters according to RECIST v.1.1. Bars are coloured according to the patient’s smoking history. Patients who discontinued before assessment, or had a value greater than 100% were capped at 100%. Bottom, forest plots show Bayesian estimates (with 95% credible intervals) of OR rates, grouped according to the smoking history of the patients. b, As for a, but coloured and grouped according to the histology of the tumour.

