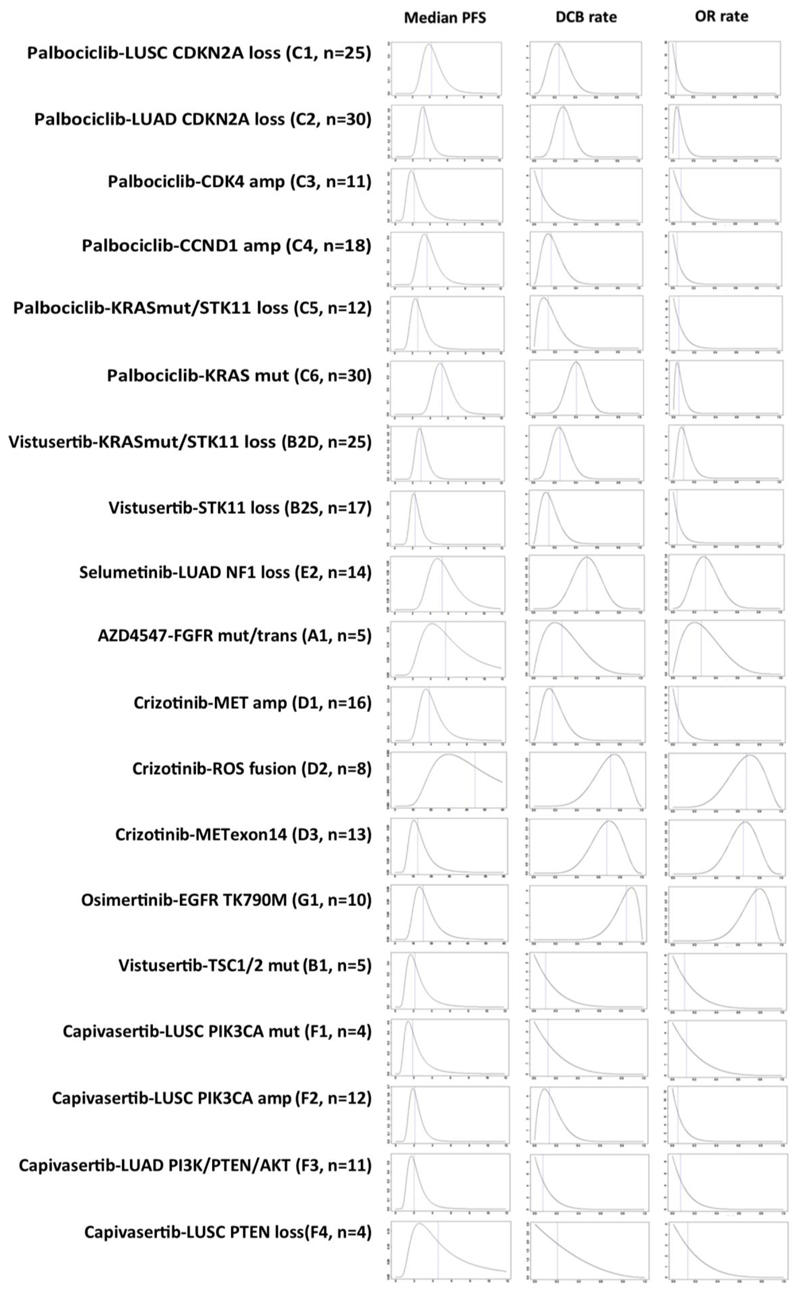
Extended Data Fig. 3. Posterior probability distribution plots by cohort for median PFS in months, DCB rate and OR rate.
Plots show the posterior probability distribution for true values of the relevant outcome measure, given the prior probability distribution and the observed data. The blue dotted line indicates the median of the posterior distribution. Given the prior and the observed data, there is an equal probability that the true value is greater than or less than the median value. Median PFS uses an inverse-gamma distribution with a prior of IG(0.001, 0.001), which provides minimal information and hence the posterior is dominated by the observed data in the trial. DCB and OR rate use a beta distribution, with a prior of Beta(1,1), which attributes equal probability to all possible rates of response from 0%–100%, and contributes data to the posterior equivalent to two trial patients. This will therefore be more influential at early stages of recruitment, but as more patients contribute their results the posterior will be dominated by the trial data. Bayesian estimates and 95% credible intervals for the true median PFS, DCB rate and OR rate are generated from these posterior probability distributions, together with PP and PPoS.

