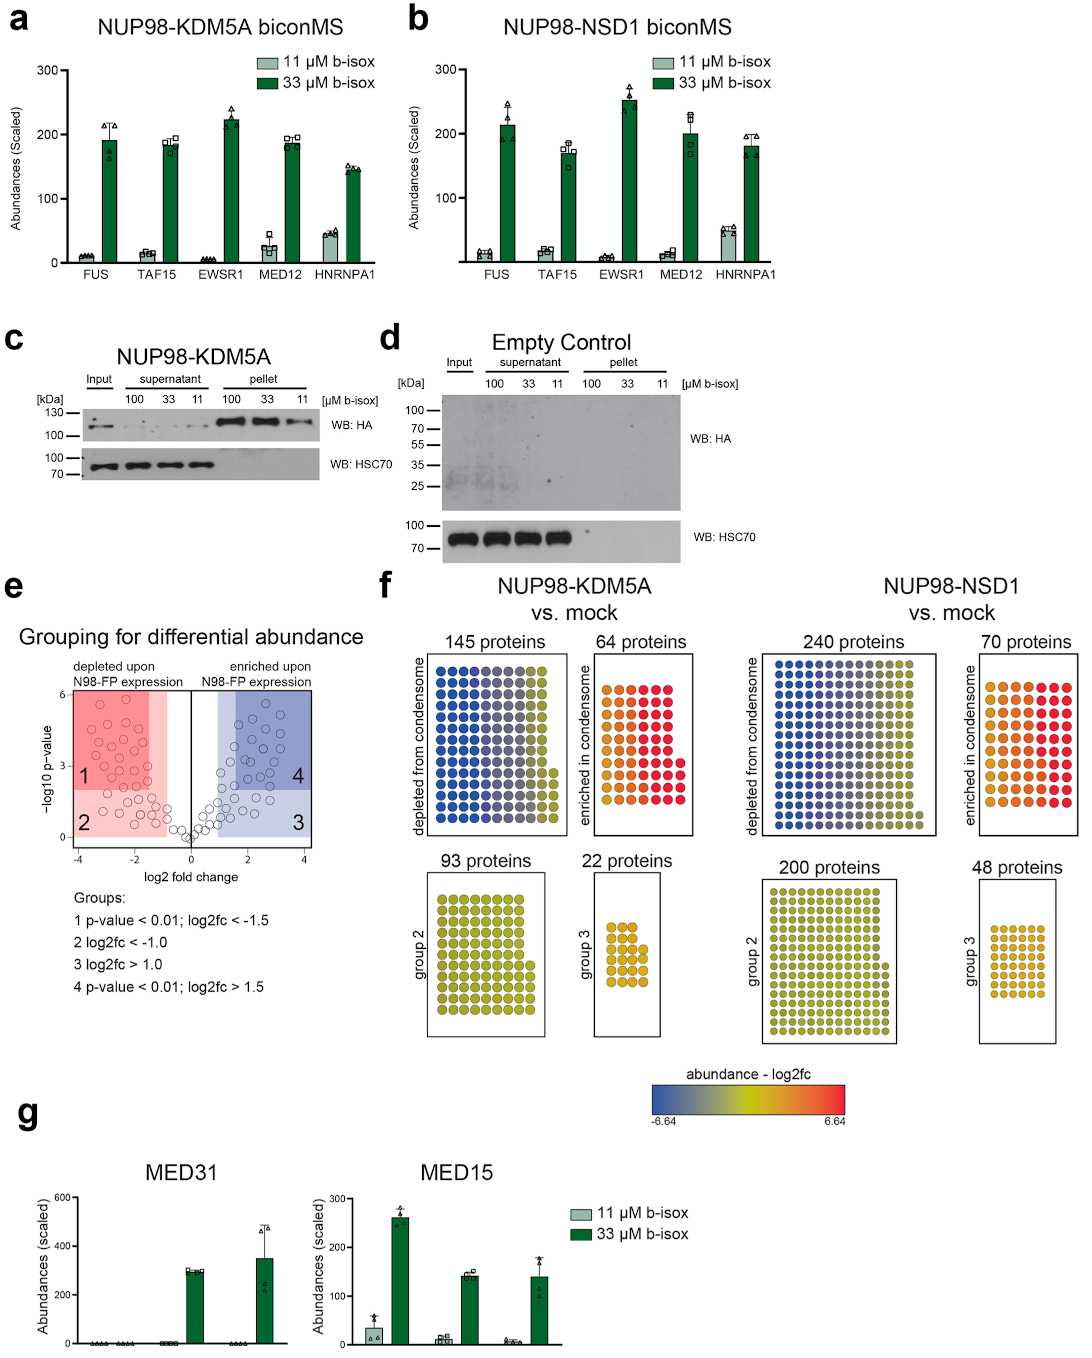
Extended Data Fig. 5. biCon-MS for NUP98-KDM5A and NUP98-NSD1, Related to Fig. 5.

a, Normalized and scaled protein abundances for selected proteins previously implicated in the formation of biomolecular condensates identified by biCon-MS from lysates of HL-60 cells expressing NUP98-KDM5A. Graph shows individual data points, mean and s.d. for n = 4 (2 biological, 2 technical replicates). b, Normalized and scaled protein abundances for selected proteins previously implicated in the formation of biomolecular condensates identified by biCon-MS within lysates of HL-60 cells expressing NUP98-NSD1. Graph shows individual data points, mean and s.d. for n = 4 (2 biological, 2 technical replicates). c, Western blot analysis of NUP98-KDM5A-expressing NIH-3T3 cell lysates treated with 11 μM, 33 μM or 100 μM b-isox. Dose-dependent precipitation was investigated for NUP98-KDM5A and HSC70 as loading control. One representative blot of three independent experiments is shown. d, Western blot analysis of NIH-3T3 cell lysates treated with 11 μM, 33 μM or 100 μM b-isox. Dose-dependent precipitation was investigated for HSC70. One representative blot of three independent experiments is shown. Blot is representative of three independent experiments. Uncropped images for panels c and d are available in Supplementary Fig. 1. e, Schematic illustration of enriched/depleted proteins identified in fusion protein biCon-MS compared to mock-transduced HL-60 cells. f, Enrichment of proteins that exhibit dose-dependent precipitation upon expression of NUP98-KDM5A and NUP98-NSD1 as compared to mock-transduced HL-60 cells based on abundances in biCon-MS analysis. Enriched/depleted proteins in NUP98-fusion protein condensates are illustrated as nodes and are colored according to calculated fold change values. Depletion cutoff: log2(fc) < −1.5 and p-value < 0.01 Enrichment cutoff: log2(fc) > 1.5 and p-value < 0.01. P-value was calculated using a two-sided ANOVA test. g, Normalized and scaled abundances of significantly enriched (MED31) or depleted (MED15) proteins in NUP98-fusion protein condensomes as identified by biCon-MS. Graph shows individual data points, mean and s.d. for n = 4 (2 biological, 2 technical replicates).
