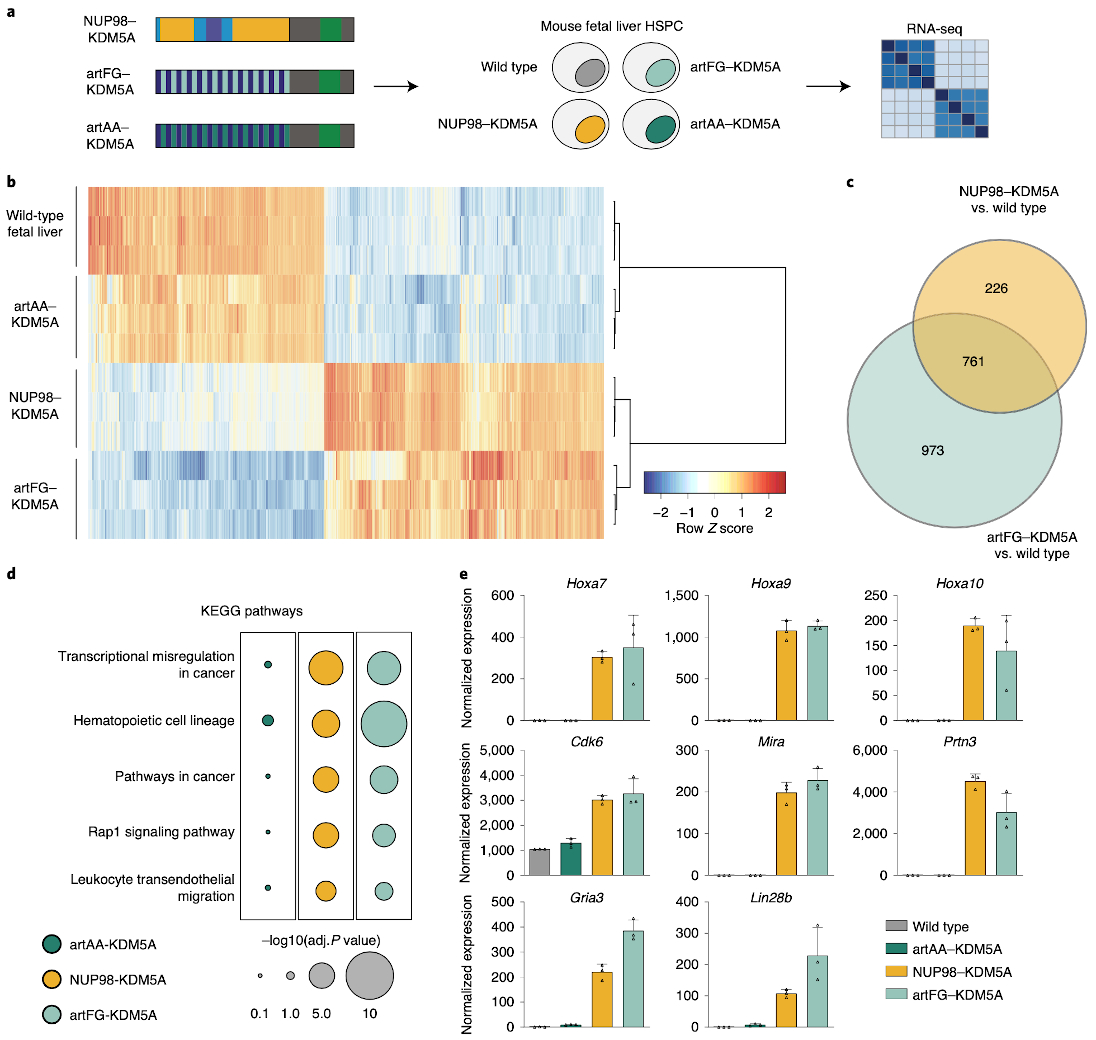
Fig. 7. Artificial FG-containing fusion proteins induce leukemogenic gene expression programs in hematopoietic progenitor cells.

a, Schematic illustration of fusion protein expression in murine fetal liver hematopoietic stem and progenitor cells, followed by RNA-seq. b, Heat map of significantly deregulated genes in NUP98–KDM5A- and artFG–KDM5A-expressing cells compared to control fetal liver cells. Rows and columns were clustered using Pearson correlation as a distance measure and ward.D clustering. Each row represents Z scores of scaled expression levels for each replicate. Only genes with P < 0.01 are shown. c, Venn diagram of differentially regulated genes in NUP98–KDM5A and artFG–KDM5A-expressing cells compared to mock-transduced cells. P < 0.001 and log2(fold change) <–2 or > 2. P values and fold changes were obtained using DESeq2 for normalization and differential gene expression analysis (Methods). d, KEGG pathway analysis for differentially regulated genes of artAA–KDM5A-, NUP98–KDM5A- and artFG–KDM5A-expressing fetal liver cells. Most significant pathways induced by NUP98–KDM5A are shown. e, Gene expression of known direct NUP98 fusion protein targets, shared between NUP98–KDM5A and artFG–KDM5A. Data are mean and s.d. of n = 3 independent biological replicates.
