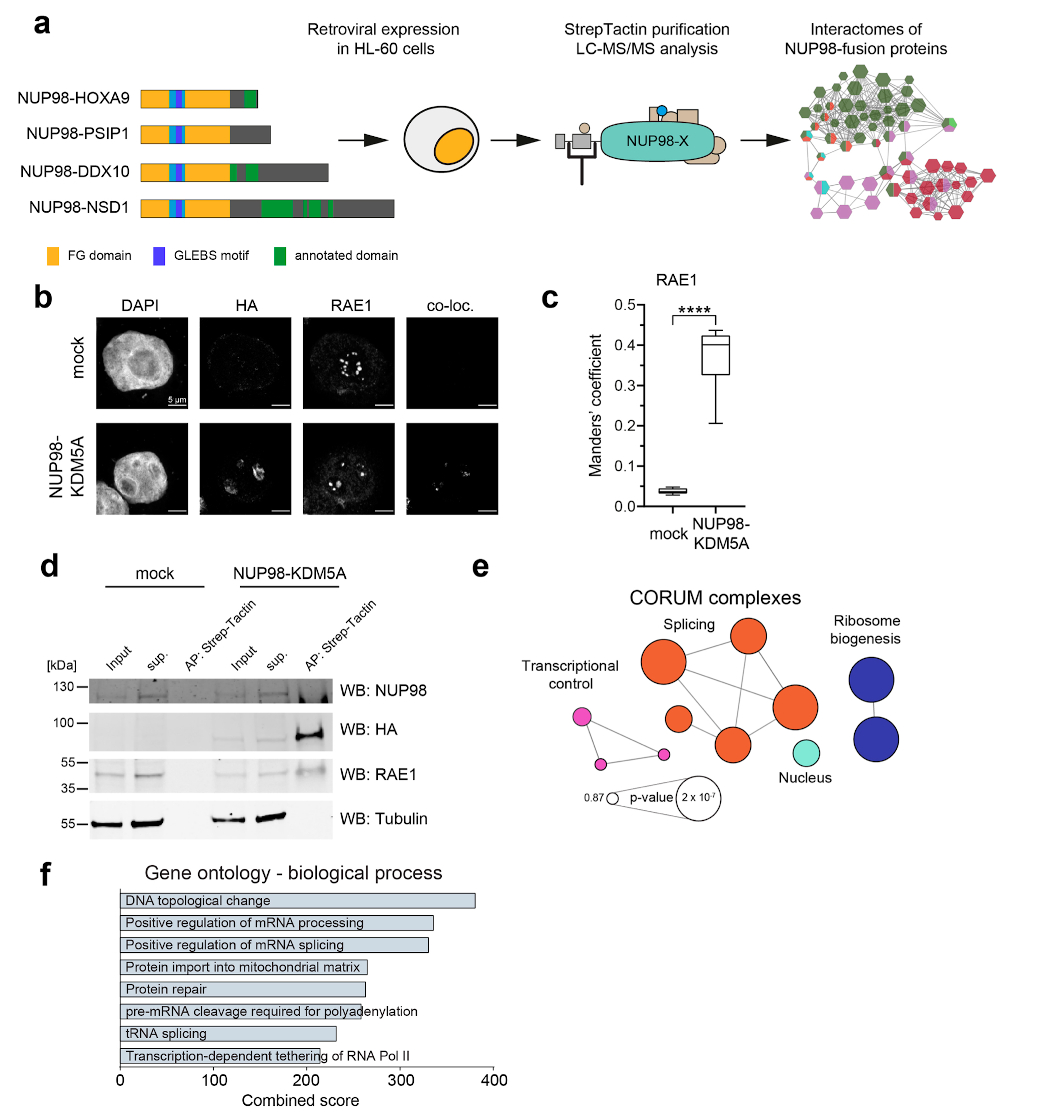
Extended Data Fig. 2. AP-MS analysis of NUP98-fusion proteins and validation of selected interaction partners, Related to Fig. 2.

a, Schematic representation of the experimental strategy. HL-60 cells were transduced with retroviral constructs encoding NUP98 fusion proteins and protein complex pulldowns were performed using Strep-Tactin followed by LC-MS/MS analysis. b, Immunofluorescence of mock transduced (top) HL-60 cells or cells expressing NUP98-KDM5A (bottom) stained with DAPI, anti-HA (background-fluorescence corrected) and anti-RAE1. Co-localization (co-loc) was determined with the ImageJ plugin ‘Colocalization’ Six independent experiments were performed with similar results. (c) Manders’ coefficient showing the co-occurrence of NUP98-KDM5A with RAE1. **** p-value < 0.0001, n = 12 cells examined over 2 independent experiments (6 mock vs. 6 NUP98-KDM5A) Two sided, paired t-test, t = -10.277, df = 5, **** p-value = 0.0001499. The box plot centre line defines the median, the box limits indicate upper and lower quartiles, whiskers indicate minima and maxima among all data points. Data behind graph are available as Source Data. d, Western blot analysis of protein lysates from control HEK293T cells or cells transfected with NUP98-KDM5A after Strep-Tactin affinity purification. Blot is representative of three independent experiments. Uncropped images are available in Supplementary Fig. 1. (e) CORUM analysis of 157 NUP98-fusion protein core interactors. Complexes are illustrated as a network highlighting top terms ranked by p-value. The network was generated with ClueGo v3.5.4. f, GO analysis (Biological Process) was performed for 157 NUP98-fusion protein core interactors. GO terms were ranked by combined score using Enrichr.
