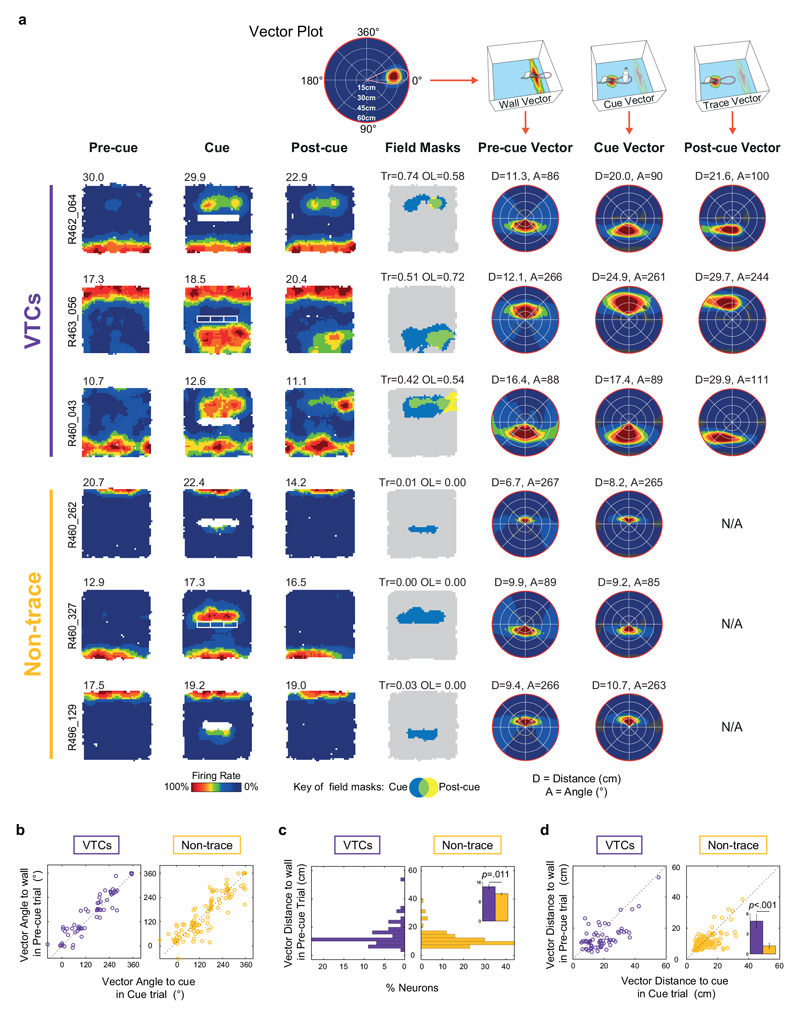
Extended Data Fig. 4. Analysis of wall vectors. Angular tunings between wall-field and cue-field vectors were similarly stable across VTCs and non-trace cells; VTCs’ distance tunings showed more variance and were longer than those of non-trace cells; distance tunings were longer for cue fields than wall fields in both cell types, but this was more pronounced in VTCs.
(A) Rate maps and vector plots for three representative VTCs, and three representative non-trace cells. Conventions as Fig.1A,B for first four columns. Conventions as Fig.2A,B for columns of vector plots: wall field vector in Pre-cue trial (5th column); cue field vector in Cue trial (6th column); and trace field (cue) vector in the Post-cue trial (7th column). Distance tuning scale is 0-60cm in all vector plots. (B) Scatterplots of angular tunings showing VTCs (left, n=64) and non-trace cells (right, n=132) showed stable angular tuning for wall-field vector in Pre-cue trial vs Cue-field vector in Cue trial. The overall mean angular difference between the wall-field and the cue field was 8.2 ± 4.4° (mean absolute angular difference: 26.2 ± 3.3°) for VTCs, and 0.9 ± 3.9° (mean absolute angular difference: 32.5 ± 3.0°) for Non-trace cells, with no difference between the cell types (Watson-Williams F1,194 = 1.32, p = 0.25; Welch t194 = 1.416, p = 0.16). For VTCs, the overall mean angular difference between the Pre-cue wall-field and the Post-cue trace field was similarly minimal at 4.1 ± 4.4° (mean absolute angular difference: 28.3 ± 2.9°). Thus, as expected, angular tunings were stable across wall fields and cue fields. The inter-trial absolute difference values involving the wall field show somewhat larger error than those in VTCs between the cue field and its trace field (19.5 ± 2.7°, see Fig 2E & main text), because square-walled environments are suboptimal for estimating angular orientation of vector fields67. (C) Histograms of distance tunings for VTCs (left) and Non-trace cells (right) for wall-field vector in Precue trial. Exactly as for cue field vectors’ distance tunings (main text, Fig.2C), VTCs’ distance tunings in their wall-field vectors showed a much wider variance than those of non-trace cells (F test variance ratio = 2.46, p < 0.001) and were longer than those of non-trace cells (Inset compares mean ± s.e.m. values: VTCs n=64: 14.1 ± 1.0cm; Non-trace n=132: 11.2 ± 0.4cm; Welch t194 = 2.605: p = 0.011). (D) Scatterplots of distance tunings for VTCs (left) and Non-trace cells (right) for wall-field vector in Pre-cue trial vs cue-field vector in Cue trial. Distance tunings were longer for cue field than wall field vectors in both cell types (VTCs: paired t63 = 5.04, p < 0.0001; Non-trace: paired t131 = 2.76, p = 0.007), and this lengthening effect was more pronounced in VTCs (Inset compares mean ± s.e.m. values: VTCs n=64: +4.9 ± 1.0cm; Non-trace n=132: +1.2 ± 0.4cm; Welch t194 = 3.435, p = 0.0009). All linear tests in this Figure were 2-tailed.

