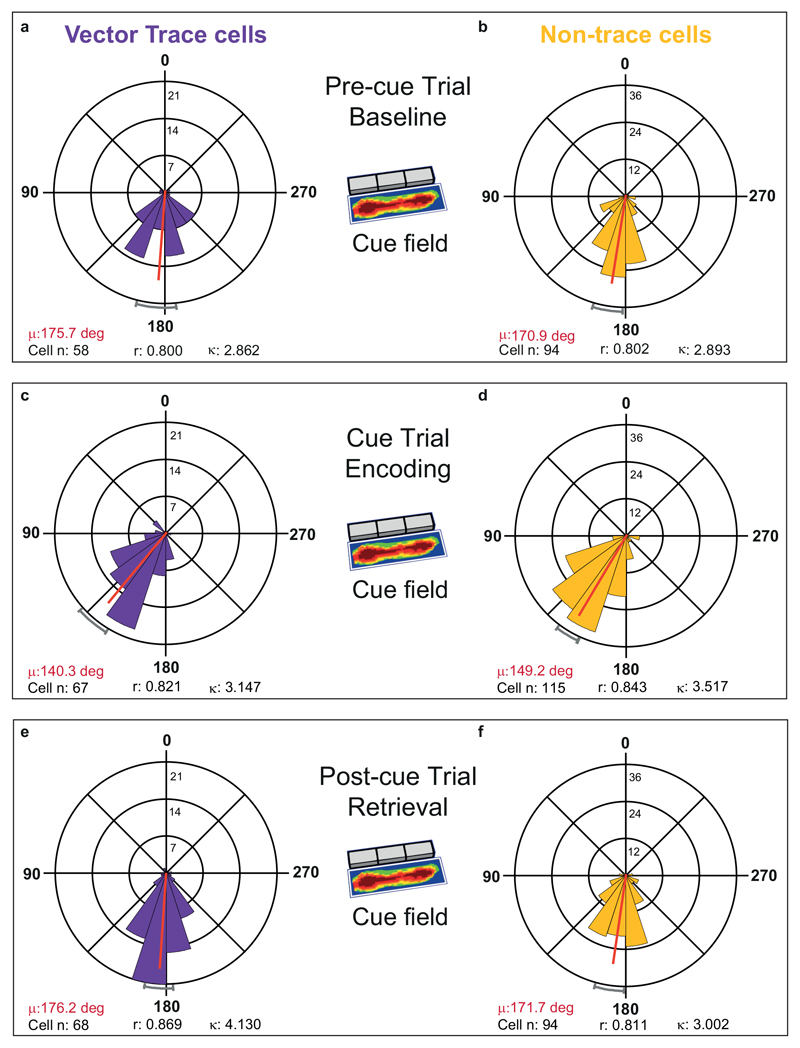
Extended Data Fig. 6. Preferred theta phase of firing shifts markedly earlier during cue-related encoding in both vector trace cells and non-trace cells.
Polar histograms showing distribution of individual cell phases in the cue field area whose mean phases (red lines, red-font text) and 95% confidence limits (grey curved caps at perimeter) are shown in Fig 6, for each of the two cell types: (A to C) trace cells, (D to F) non-trace cells, from Pre-cue trials (A,D), to Cue trials (B,E), to Post-cue trials (C,F). Preferred theta phase of firing is very stable across Pre-cue and Post-cue trials in both cell types. Notably, against this background of strong phase stability, preferred theta phase of firing is markedly earlier in both cell types during Encoding trials (Cue Trial: B,E) than during Baseline (Pre-cue Trial: A,D) and Retrieval (Post-cue Trial: C,F) trials (all Cue-vs-Pre-cue & Cue-vs-Post-cue F values >19.25, all p values < 1.82 x 10⁻⁵). Within-cell earlier shift in Encoding was greater in vector trace cells than non-trace cells (main text; Fig 6) There were no within-trial, across-cell-type, absolute-phase differences (Watson-Williams F tests: Pre-cue trial: F1,150 = 0.55, p = 0.46; Cue-trial: F1,180 = 2.81, p = 0.10; Post-cue trial: F1,160 = 0.69, p = 0.41). Phases are divided into twenty 18-degree bins (0/360:peak,180:trough). Vertical scale near zero-degree line indicates number of cells in a given phase bin. Key: μ is mean phase (red line, red font text), r is length of Rayleigh vector (also indicated by length of red mean phase line, from centre to outer circumference), k is Von Mises’ k (indexing phase concentration). Grey curved caps depict +/- 95% confidence limits.

