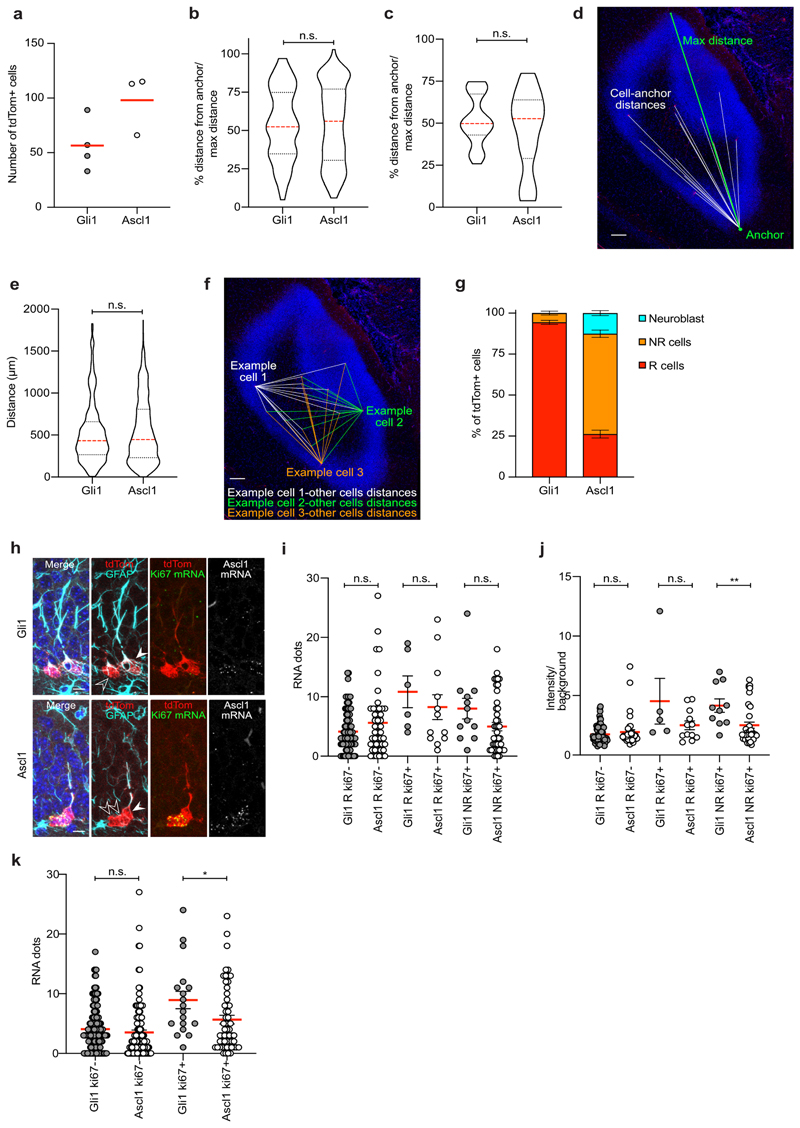
Extended Data Fig. 1. Characterization of Gli1 and Ascl1-targeted cells.
a, Number of tdTom+ cells in the SGZ 2d after recombination in Gli1 (n = 4 mice) and Ascl1 (n = 3 mice). b, Percentage of the distance of tdTom+ R cells from the anchor/max distance in Gli1 and Ascl1 at 2dpi. Horizontal sections, first 300 μm of DG are considered (Gli1: 53.93 ± 2.27, n = 106 cells; Ascl1: 54.35 ± 1.83, n = 199 cells; Mann Whitney test: Mann-Whitney U = 10407; p = 0.849, two-tailed). c, Percentage of the distance of imaged clones from the anchor/max distance in Gli1 and Ascl1 at 2mpi. Horizontal sections (Gli1: 51.6 ± 2.31, n = 40 clones; Ascl1: 45.6 ± 5.63, n = 18 clones; Mann Whitney test: Mann-Whitney U = 337; p = 0.708, two-tailed). d, Representation of the method used to quantify the distances between R cells and the anchor. Horizontal view of the DG. e, Quantification of the distance between pairs of tdTom+ R cells in Gli1 and Ascl1 at 2dpi. Horizontal sections, first 300 μm of DG are considered (Gli1: 523.5 ± 14.86, n = 608 pair of cells; Ascl1: 546.1 ± 9.25, n = 1696 pair of cells; Mann Whitney test: Mann-Whitney U = 505390; p = 0.469, two-tailed). f, Representation of the method used to quantify the distances between pair of R cells (only the pairings of 3 R cells with all the other R cells in the section are shown as examples). Horizontal view of the DG. g, Quantification of tdTom+ cell types in the SGZ 2d after recombination in Gli1 (n = 4 mice) and Ascl1 (n = 3 mice). h, Representative pictures of RNA-Scope with Ki67 probe (green) and Ascl1 probe (grey) and immunostaining for tdTomato (red) and GFAP (cyan) of Gli1 and Ascl1-targeted cells at 5dpi. Filled arrowheads point to R cells; empty arrowheads point to NR cells. i, Quantification of the Ascl1 mRNA dots of: R ki67- cells (Gli1: 4.136 ± 0.366, n = 88 cells; Ascl1: 5.617 ± 0.851, n = 47 cells; Unpaired t-test: t = 1.855; df = 133; p = 0.065, two-tailed), R ki67+ cells (Gli1: 10.83 ± 2.676, n = 6; Ascl1: 8.250 ± 2.089, n = 12; Unpaired t-test: t = 0.734; df = 16; p = 0.473, two-tailed), NR ki67+ cells (Gli1: 8.000 ± 1.741, n = 12; Ascl1: 4.978 ± 0.7160, n= 45; Unpaired t-test: t = 1.834; df = 55; p = 0.0721, two-tailed). j, Quantification of the Ascl1 mRNA levels (fluorescence intensity of the cell/background) of: R ki67- cells (Gli1: 1.739 ± 0.083, n = 77 cells; Ascl1: 1.933 ± 0.198, n = 40 cells; Unpaired t-test: t = 1.055; df = 115; p = 0.293, two-tailed), R ki67+ cells (Gli1: 4.528 ± 1.919, n = 5; Ascl1: 2.502 ± 0.369, n = 12; Unpaired t-test: t = 1.54; df = 15; p = 0.144, two-tailed), NR ki67+ cells (Gli1: 4.157 ± 0.566, n = 10; Ascl1: 2.510 ± 0.258, n= 39; Unpaired t-test: t = 2.815; df = 47; **p = 0.007, two-tailed). k, Quantification of the Ascl1 mRNA dots of: ki67- cells (Gli1: 4.067 ± 0.295, n = 149 cells; Ascl1: 3.516 ± 0.405, n = 124 cells; Unpaired t-test: t = 1.121; df = 271; p = 0.263, two-tailed), ki67+ cells (Gli1: 8.944 ± 1.454, n = 18; Ascl1: 5.667 ± 0.728, n = 57; Unpaired t-test: t = 2.141; df = 73; *p = 0.035, two-tailed). Values are shown as mean ± s.e.m. Bars in violin plots represent median and quartiles. Scale bars represent 100 μm (d,f) and 10 μm (h). For detailed statistics, see Supplementary Table 5.1

