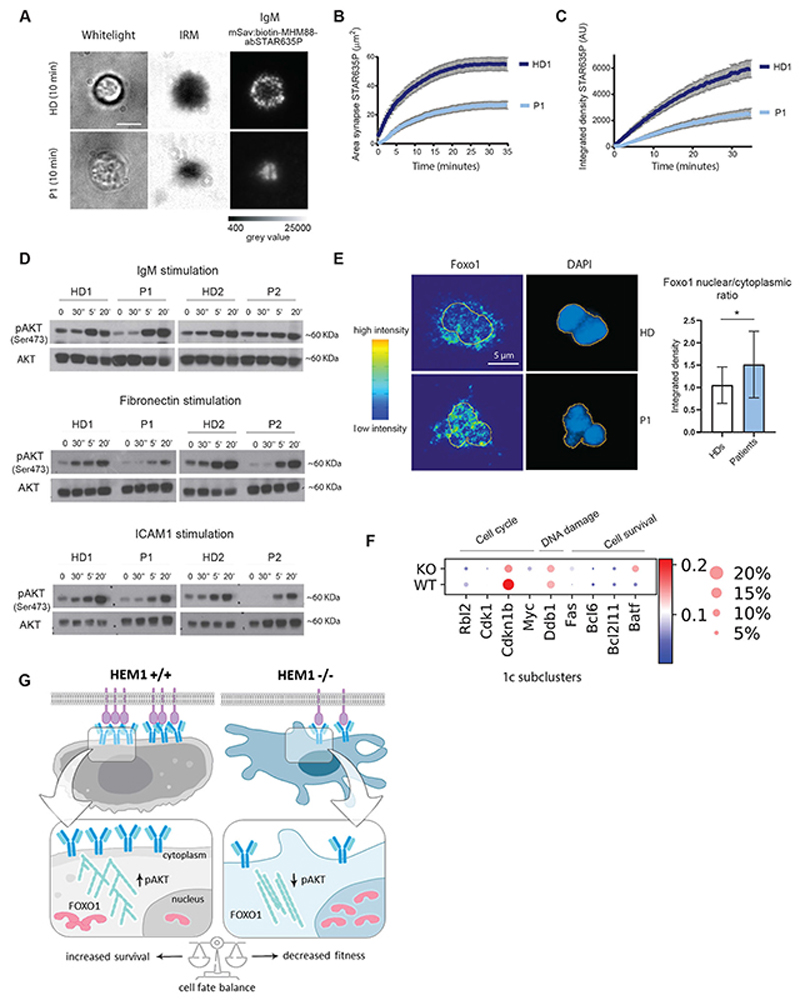
Fig. 7. Disrupted BCR signaling in HEM1 deficiency.
(A) Healthy donor (top) and patient (bottom) B cells following IgM stimulation using a planar-supported lipid bilayer functionalized with a monovalent streptavidin platform presenting biotinylated and abSTAR635P-conjugated MHM-88 mAbs, transmission light, TL (left), Interference Reflection Microscopy, IRM (middle) and IgM (right). Scale bar: 5μM. (B) Area of IgM (abSTAR635P)/μm2 over time illustrates accumulation of IgM at the immune synapse. (C) Integrated density of IgM [Arbitrary Unit (AU)] over time illustrates intensity of IgM at the immune synapse (HD1-dark blue, patient 1 (light blue) (D) Representative EBV-LCL transformed B-cells Western blots of P1, P2 and 2 healthy donors of pAKT (Ser473) and total AKT including ratios of phospho/total AKT by IgM, fibronectin and ICAM1 stimulation. (E) Immunofluorescence staining of patient and healthy donor-derived primary B cells for Foxo1 and DAPI following IgM stimulation illustrating increased levels of Foxo1 in the nucleus of P1. Quantification of nuclear/cytoplasmic ratio of both P1 and p2 (pooled) and two healthy donors. The yellow line indicates the nuclear border, intensity map (left). (F) Representative graphs for Foxo1 target genes regulating cell cycle progression (Rbl2, Cdk1, Cdknlb, Myc), DNA damage (Ddb1) and apoptosis (Bcl6, Bcl2lll, Batf). (G) Scheme illustrating proposed mechanism.

