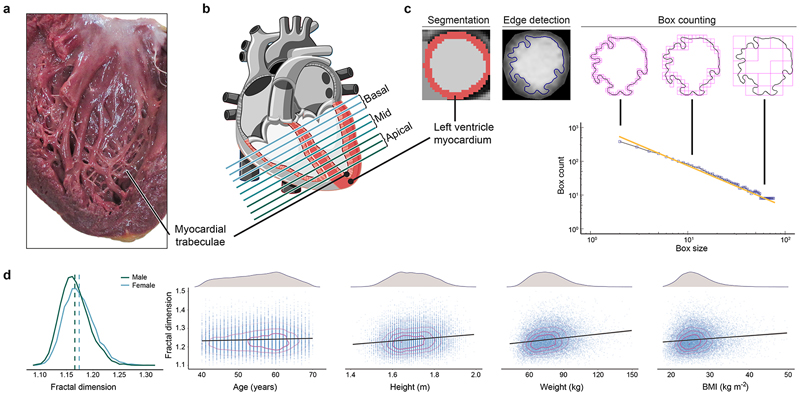
Figure 1. Trabeculation phenotypes and covariates.
a) Macroscopic cut pathological section of the left ventricle demonstrating the branching network of muscular trabeculae lining the endocardial surface (Arpatsara/Shutterstock.com). b) Diagram of the heart illustrating the positioning of sections acquired during cardiac magnetic resonance (CMR) imaging for the assessment of trabecular complexity (GraphicsRF/Shutterstock.com). c) Deep learning image segmentation was used for anatomical annotation of each pixel in the CMR dataset and to define an outer region of interest for subsequent fractal analysis. A binary mask was taken of the image followed by edge detection of the trabeculae. Box-counting across a range of sizes generated a log-log plot from which the gradient of a least-squares linear regression defined the fractal dimension. d) Distribution of fractal dimension and its relation to covariates used in the association study (n=18,096).

