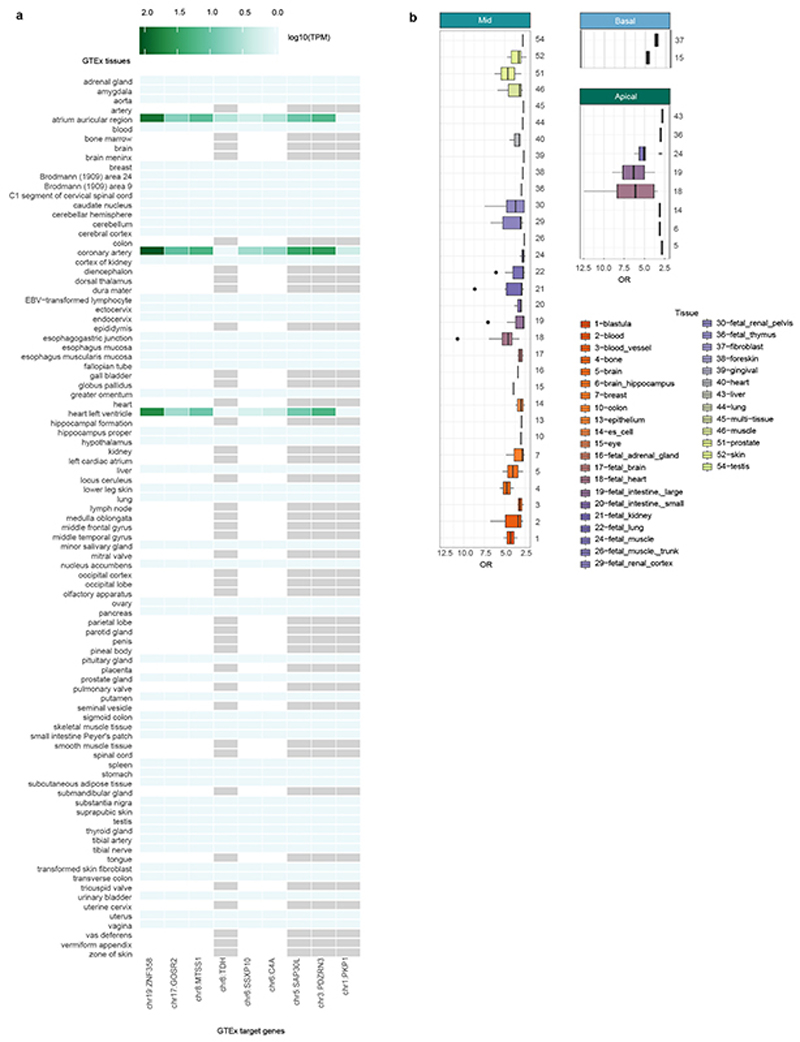
Extended Data Figure 6. Annotation of trabeculation associated loci.
a. Gene expression of GTEx associated genes and tissues. Gene expression in log10 transcripts per million (TPM) for genes whose expression is associated with trabeculation loci (via GTEx look-up, Supplementary Data 3). Gene expression values and tissues were downloaded from https://www.ebi.ac.uk/gxa/home by querying: gene name AND tissue AND species, i.e. GTEx gene AND heart component AND Homo sapiens. Light grey tiles indicate NA gene expression values for gene/tissue pair. b. Enrichment of trabeculation associated variants in DNaseI Hypersensitive sites for all available tissues in GARFIELD. GARFIELD was used to compute the functional enrichment (odds ratio, OR) of genetic variants associated with the trabeculation phenotypes (GWAS: n=18,096, p-values derived from linear association t statistic) at p < 10−6 for open chromatin regions. The results across all available studies per tissue are depicted in boxplots. Lower/upper hinges: 25th and 75th percentiles (IQR); horizontal line: median; lower/upper whisker extends from the hinge to the smallest/largest value no further than 1.5 × IQR.

