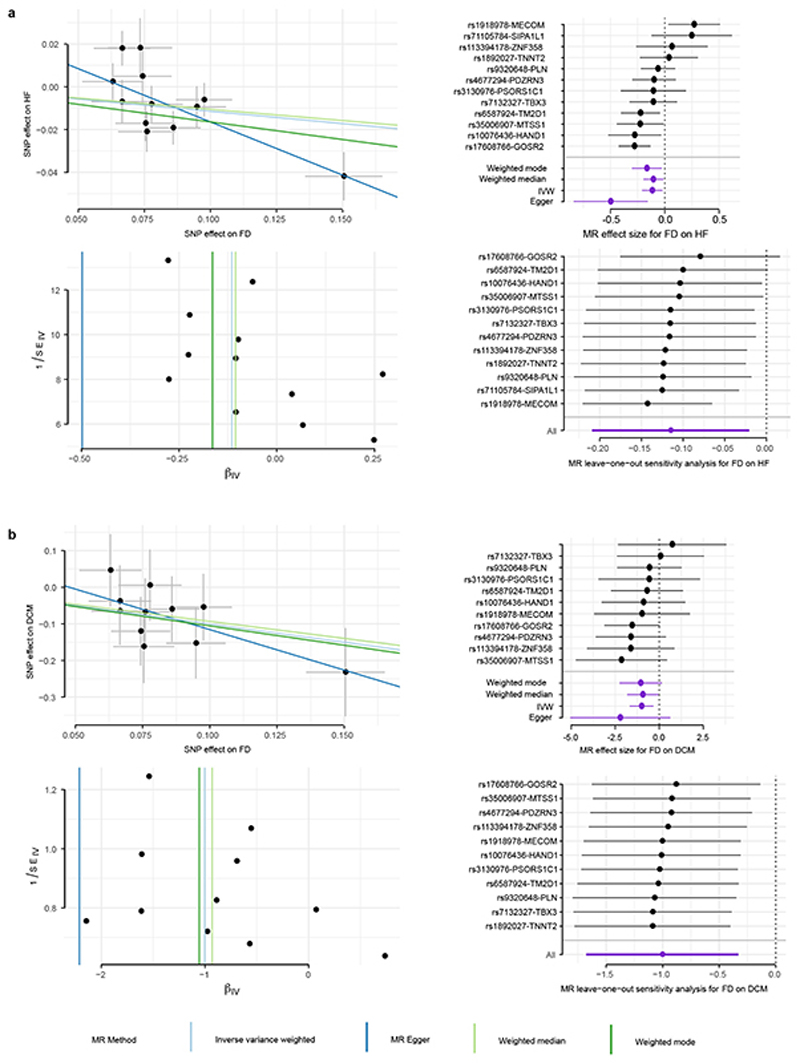
Extended Data Figure 8. MR analysis of trabeculation on heart failure (HF) and dilated cardiomyopathy (DCM).
a. MR on HF with HF effect size estimates based on ncases = 47, 309 and ncontrols = 930, 014 in HERMES study.20 b. MR on DCM with DCM effect size estimates based on ncases = 1, 136 and ncontrols = 510. For all panels in a. and b. FD effect size estimates from uni-variate GWAS results on n=18,096 samples. Scatter plots (upper left) depict the genetic variant-exposure effect versus the genetic variant-outcome effect. Center values show effect size estimate on FD and DCM, error bars indicate standard error of association test (t-statistic for FD, logistic regression for HF). Forest plots (upper right) show the contribution of each genetic variant to the overall estimate (black; estimated by Wald ratio) and combined as a single genetic instrument (purple; estimated by indicated method) for the four tested MR methods (see legend). Funnel plots (lower left) depict the instrument strength against the causal effect of each instrument as a single IV. Vertical lines indicate the average estimated effect for the tested MR methods. Strong instruments are close to the estimated average effect, while weak instruments spread evenly on both sides. Leave-one-out plots (lower right) show the results of MR analysis (IVW only) where each genetic variant is sequentially excluded and can indicate if there are any single variants that drive the MR results. In right panels, center values mark effect size point estimates, error bars the 95% confidence intervals.

