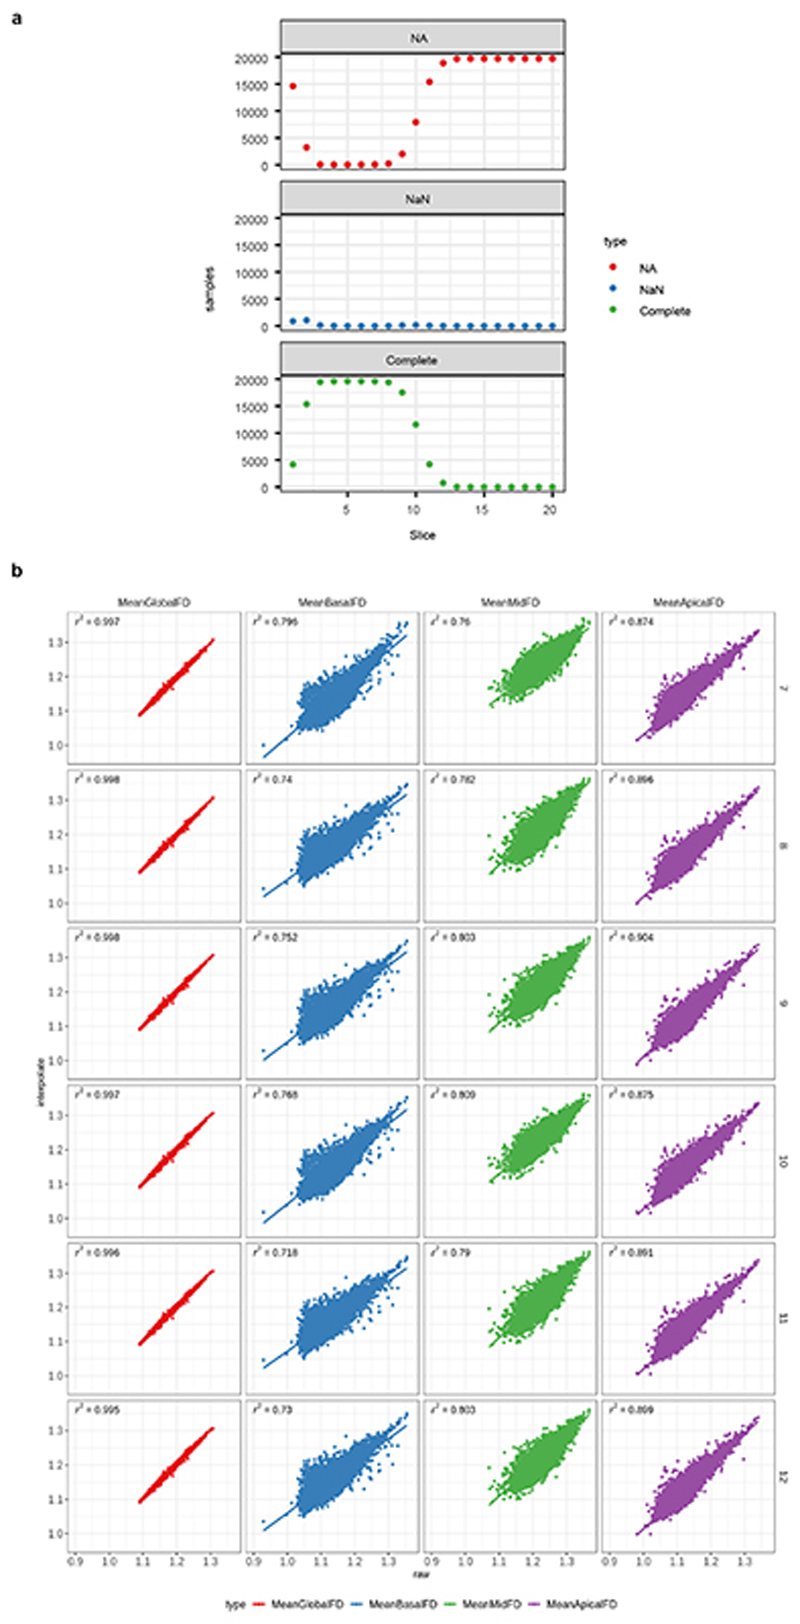
Extended Data Figure 2. FD phenotypes.
The upper panels show the distribution of CMR image slices where FD was successfully measured. Missing FD measurements per slice can either arise because a slice was not measured (NA) or the FD estimation failed due to poor image quality or estimated FD failing quality control (NaN). a. depicts the distribution in the UK Biobank samples (n=19,761), b. the distribution in the UK Digital Heart samples (n=1,901). The lower panels show the correlation between FD summary measures derived from the observed FD slice measurements and interpolated FD measurements per sample. Interpolated FD measurements per sample were derived by using a Gaussian kernel local fit to a different numbers of slice templates, allowing for direct slice comparisons across individuals. Different numbers of slices for interpolation were tested (rows). Columns show different summary measures, either mean FD across all measured slices or mean FD per slice region. c. Linear model of measured interpolated (r 2) of the summary measures between measured and interpolated FD in the UK Biobank samples (n=19,761), d. linear model in the UK Digital Heart samples (n=1,901).

