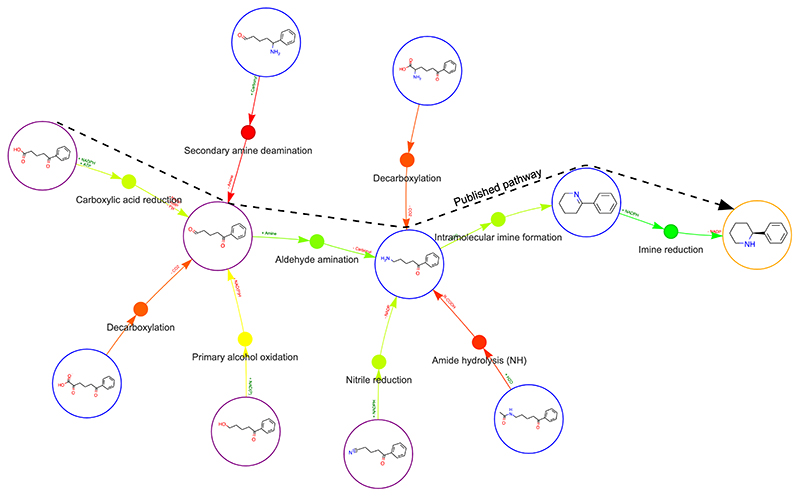
Extended Data Fig. 1. An example generated using Network Explorer to illustrate changes in molecular complexity.
Arrows and reactions are coloured by the change in molecular complexity, determined using the SC-Score. Green indicates a negative change in molecule complexity, which in most cases corresponds to a synthetically useful transformation. Red indicates a positive change in molecular complexity. Colours are determined relative to the other transformations leading to a specific molecule. Some reactions have been removed for clarity. Pathway published in reference 68.

