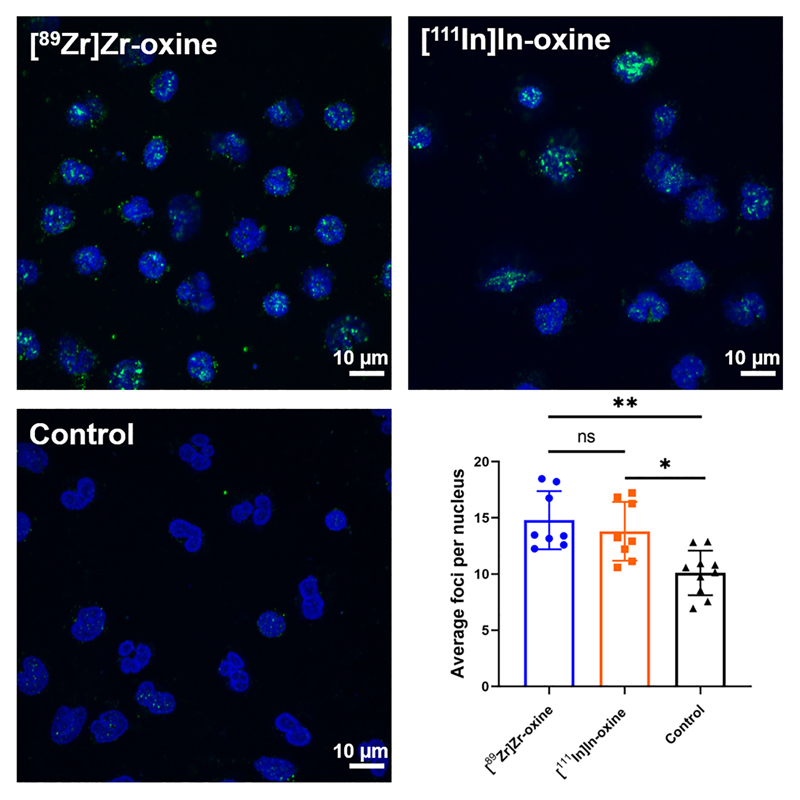
Fig. 7. Comparison of DNA damage induced by [89Zr]Zr-oxine and [111In]In-oxine in WBC.
Representative images (maximum intensity projections) of WBC labelled with [89Zr]Zr-oxine (top left), [111In]In-oxine (top right) or PBS only (bottom left), showing γH2AXfoci (green) and cell nuclei (blue). Scale bars represent 10 μm. Bottom right: average number of γH2AX foci per nucleus (at least 30 nuclei analysed per sample). Each point represents an individual donor, bars show the mean value of n = 8 donors. ns: P ≥ 0.05, *P < 0.05, **P < 0.01 (mixed-effect analysis with Tukey’s correction for multiple comparisons, performed on log-transformed data).

