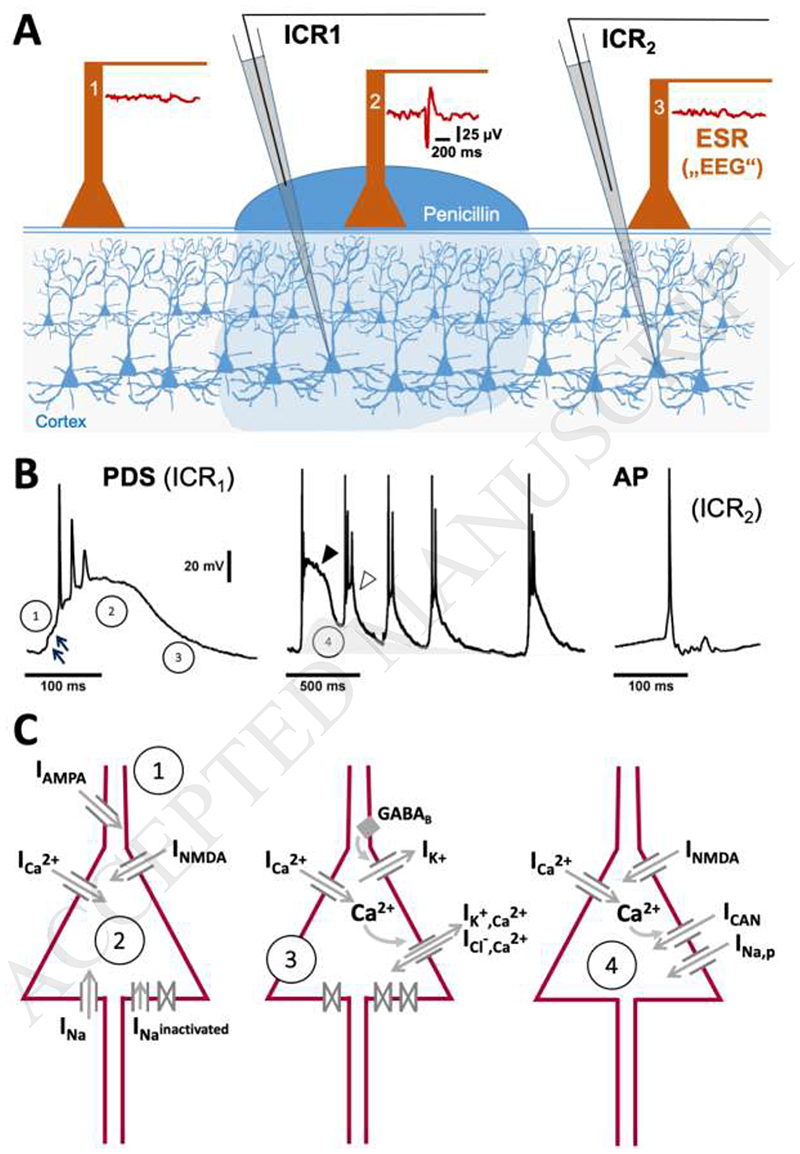
Fig. 1. First identification, typical appearance and ionic basis of paroxysmal depolarization shifts.
A) Matsumoto and Ajmone Marsan (1964) performed simultaneous intracellular (ICR) and extracellular surface recordings (ESR) from cat cortex, on which epileptic foci were generated by topical application of penicillin. Both ictal and interictal manifestations were observed. The illustration shows the situation for interictal manifestations. The extracellular surface electrode (ESR) within the penicillin focus picked up electrographic spikes (an example is shown to the right of ESR electrode 2) at the same time as PDS were detected in subjacent neurons (this is exemplified for a recording with ICR1 in panel B, left trace). Hence, it was concluded that PDS represent the (single-unit) cellular correlate of electrographic (“interictal”) spikes, which result from the synchronous occurrence of PDS in many neurons of the epileptic focus. PDS are distinctly different from normal action potentials (APs) that can be monitored in untreated cortex areas (e.g. with ICR2, see the right trace in panel B). B The exemplary traces highlight the differences between PDS and APs and show that PDS can occur in clusters (middle trace). The circled numbers refer to the schemes in C, which illustrate the ionic currents (I) that contribute to individual PDS formation (1-3), and to the slow depolarizing wave enabling PDS clusters (4).

