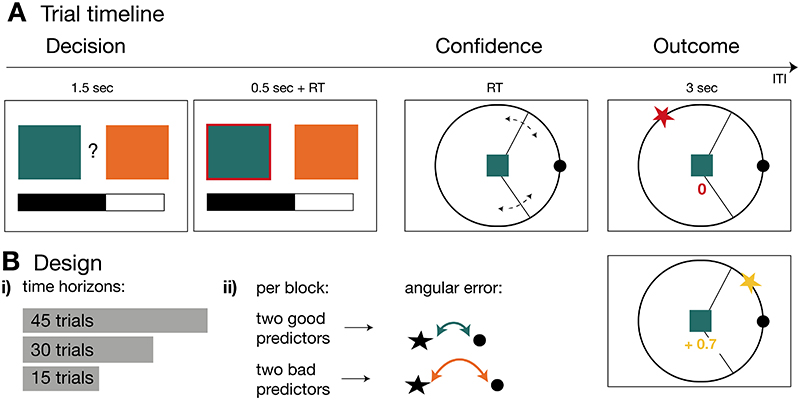
Figure 1. Experimental Task and Design.
(A) Trial timeline. In each trial, participants made two choices. First, a binary choice between two predictors (coloured boxes; decision phase) to receive information about a target’s location on a circle. The goal was to choose predictors that accurately predicted the target location. The length of a black bar at the bottom of the screen informed participants about the number of remaining trials in the current block. Second, participants indicated their belief in the accuracy of the chosen predictor by modifying the size (dotted lines) of an interval symmetrical around the reference point (confidence phase). In the outcome phase, the target location (star) and any points earned were indicated. Two possible example outcomes are illustrated. In the above case, the participant’s prediction was incorrect as the target fell outside the interval, resulting in a null payoff. In the bottom case, the target fell within the interval, resulting in a positive payoff. Positive payoffs increase with narrower intervals as long as the target falls within the interval. (B) Design. (B-i) Participants transitioned through blocks of different numbers of trials (time horizons). (B-ii) Each time horizon introduced four new predictors (illustrated as boxes) that were categorised into two good (green and yellow boxes) and two bad predictors (orange and blue boxes) according to how well they predicted the target. The quality of predictions was determined by the angular error between target and reference location with a smaller angular error representing better target predictions.

