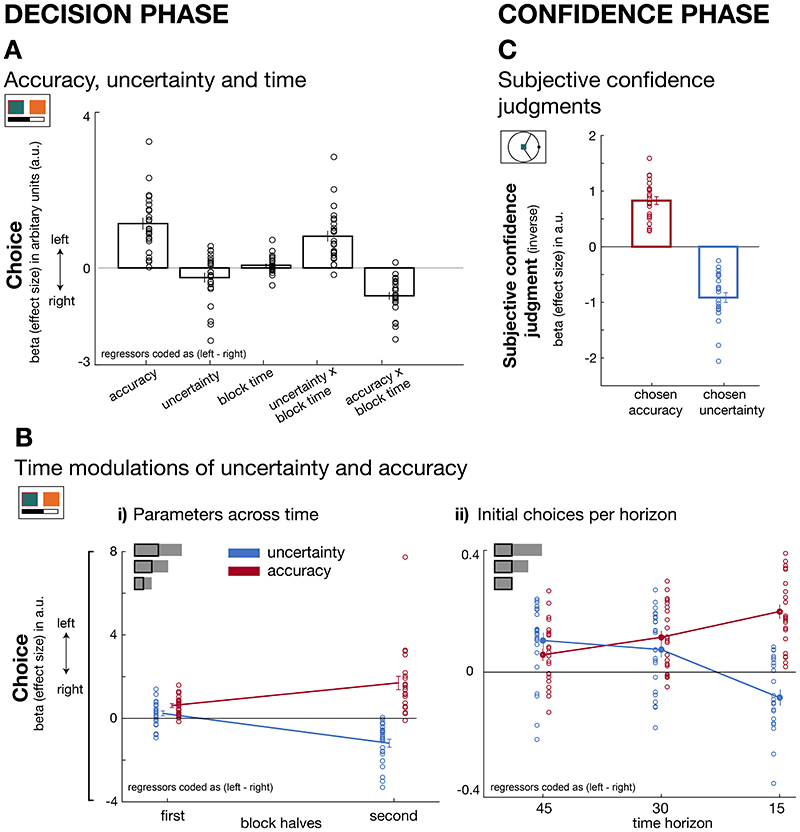
Figure 3. Dissociable effects of accuracy and uncertainty on predictor selections and subjective confidence judgments.
(A) Decision phase. By using logistic GLM analyses we predict leftward predictor selection as a function of several variables (coded as left minus right). In general, participants preferred accurate predictors (accuracy: t(23)=7.5, p<0.001, d=1.52,95% confidence interval=[0.8 1.45]). There was no credible evidence for an uncertainty effect on behaviour (t(23)=-1.9, p= 0.07, d=-0.39,95% confidence interval=[-0.51 0.018], Bayes factor10=1.05, %error=1.1017e-4). However, uncertainty and accuracy exerted different effects depending on when choices were made: uncertain predictors were explored when many trials remained (positive interaction term with percentage of remaining trials, i.e. block time; t(23)=5.8, p<0.001, d=1.18,95% confidence interval=[0.53 1.1]), whereas decisions were accuracy-driven as the end of a block approached (negative interaction effect with block time; t(23)=7.5, p<0.001, d=-1.53,95% confidence interval=[-0.91 -0.52]). (B) Decision phase. (B-i) Trials were binned into first and second halves of each block (independent of time horizon length) to examine the interaction effects shown in panel A. Earlier choices (i.e. first half) were more uncertainty-driven compared to later (i.e. second half) choices when uncertainty was avoided (paired-test early vs late: t(23) = -8.1, p<0.001, d=1.66, 95%confidence interval=[1.06 1.8]). In contrast, accuracy determined choices throughout both early and late block halves, but increasingly so in the second half (paired t-test early vs late: t(23) =-4.2, p<0.001, d=-0.85,95%confidence interval=[-1.63 -0.55]). Both accuracy and uncertainty changed differently across block halves (paired t-test between differences of block halves for accuracy and uncertainty: t(23) = -8.1, p<0.001, d=-1.7, 95% confidence interval =[-2.27 -1.02]). (B-ii) Accuracy and uncertainty effects on choice also varied as a function of how many trials still remained within a block: differences in the initial choice patterns (first 15 trials; see inset) across horizons showed that the exploration of uncertain predictors was more pronounced when horizons were longer while shorter horizons demanded more rapid exploitation of predictors estimated as most accurate (3x2 ANOVA: F(2,46)=36.7, p<0.001, η2=0.62). (C) Confidence phase. Trial-by-trial confidence judgments increased (i.e. the confidence interval size decreased) when selecting predictors that were believed to be accurate (t(23)=11.7, p<0.001, d=2.4, 95%confidence interval=[0.66 0.98]) but decreased when predictors were believed to be uncertain according to the Bayesian model (t(23)=-10.4, p<0.001, d=-2.12,95% confidence interval=[-1.1 -0.73]. Note that we used the inverse of the confidence interval such that a greater confidence index also represents higher confidence. (n = 24; error bars are SEM across participants).

