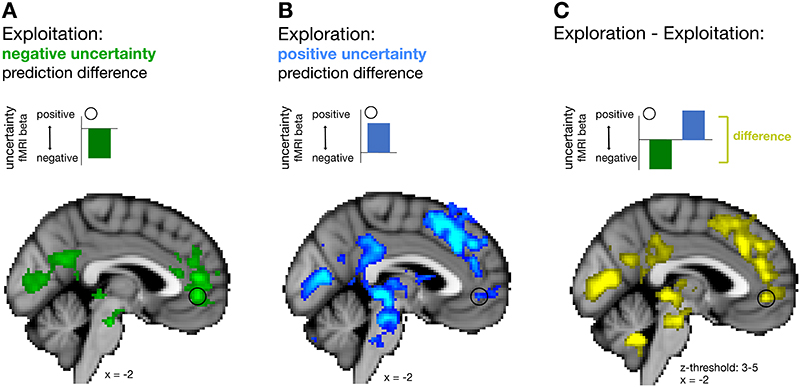
Figure 5. Whole brain maps for uncertainty prediction difference during exploration and exploitation.
Illustrations above whole-brain images clarify the polarity (positive or negative) of the uncertainty prediction difference signal represented in vmPFC (indicated by the black circle) during exploitation, exploration and their contrast. (A) During exploitation, activity related to an uncertainty prediction difference was restricted to a region centred on vmPFC and was represented with a negative polarity (see inset). (B) However, during exploration uncertainty prediction difference was represented with a positive polarity and associated with an extended network including vmPFC but also dorsomedial frontal areas peaking in dorsal anterior cingulate cortex (dACC) (see also Supplementary Figure 6). (C) Difference in uncertainty prediction difference between exploration and exploitation. Contrasting activations between the behavioural modes of exploration and exploitation confirmed the presence of mode-specific (e.g. dACC) and mode-general (e.g. vmPFC) activations. Note that the sign of activation patterns resulting from a contrast between exploration and exploitation need to be interpreted with reference to the levels of activity found in the exploration and exploitation phases with respect to baseline (see illustration above each whole-brain map) (n = 24; whole-brain effects family-wise error cluster corrected with z > 2.3 and p < 0.05).

