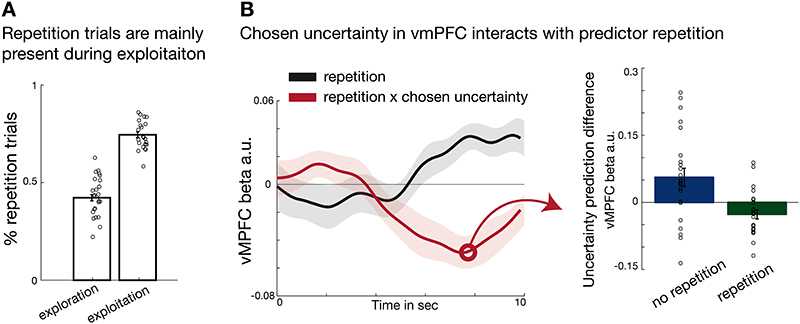
Figure 6. Interaction of repetition and uncertainty representation in vmPFC.
(A) The percentage of choice repetitions during exploitation was significantly higher than during exploration (paired t-test explore vs exploit: t(23)=-16.2, p <0.001, d= -3.3,95% confidence interval = [-0.36 -0.28]). Also note that within the two phases, this indicates a relative predominance of repetitions versus no repetitions in exploitation, but a relative predominance of no repetition choices versus repetitions in exploration. (B) VmPFC activity increased when participants repeated the same predictor selection as they had made on the last encounter with the predictor (grey time course; repetition is coded as “repeat – no repeat”; t(23) = 4, p <0.001, d= 0.8,95% confidence interval=[0.017 0.06]). Moreover, we found a significant interaction effect of repetition × chosen uncertainty (red time course; t(23) = -3.4, p =0.002, d= -0.7,95% confidence interval=[-0.07 -0.02]). The interaction effect is illustrated in the right panel by decomposing it into the binned effects of chosen uncertainty during “repetition” and “no repetition” trials at the time of the interaction effect time course peak. This indicates that the increase in BOLD response accompanying choice repetition was even stronger if participants were very certain about their choice (i.e. negative uncertainty during repetition; green bar in right panel); whereas in case of switching choices, the BOLD signal increased as a function of chosen uncertainty (i.e. positive uncertainty; blue bar in right panel). Note that the statistical test comparing the blue and green bars was performed in the leftward panel of B by testing the interaction effect against zero (n = 24; error bars are SEM across participants).

