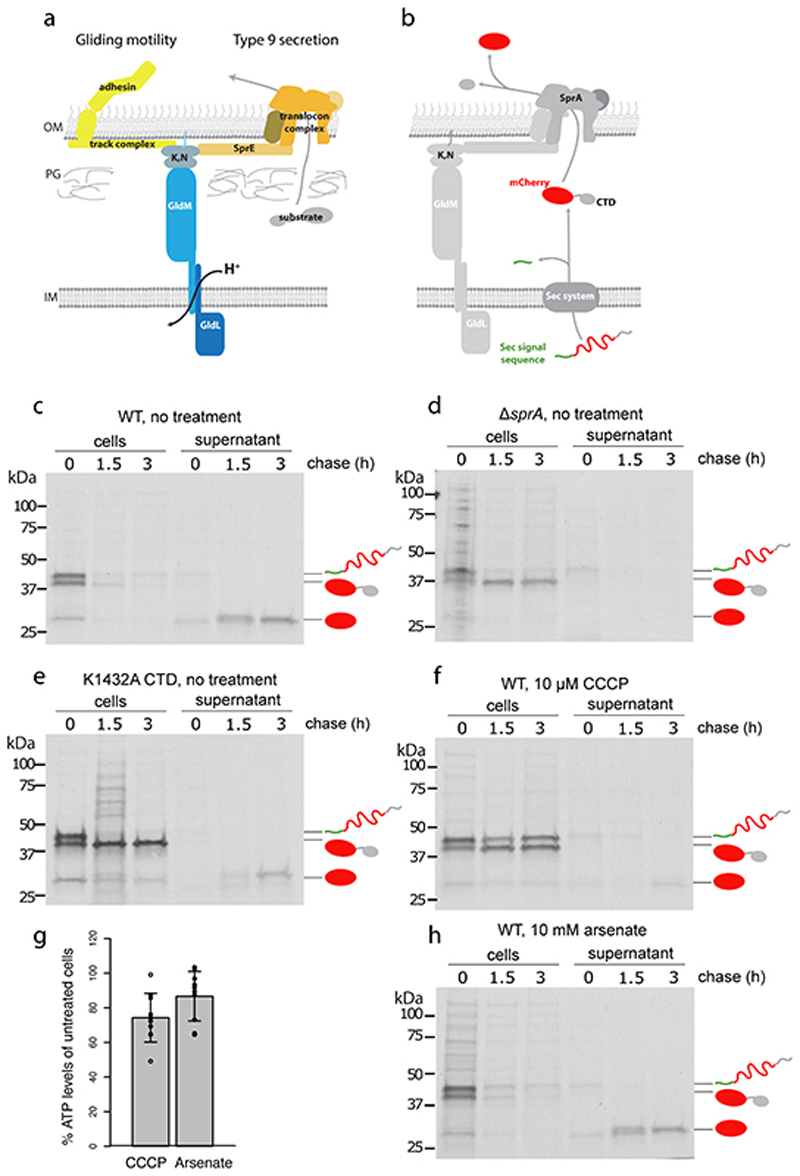
Fig. 1. Both gliding motility and Type 9 protein export require GldLM and the protonmotive force.
a, Schematic showing the proposed relationship of the GldLM complex to the major components of the gliding motility (left) and Type 9 protein transport (right) systems. OM, outer membrane; IM inner membrane; PG peptidoglycan; K, N indicates the complex of GldK and GldN proteins.
b, Schematic showing the two-stage export process of the model T9SS substrate protein SSRemA-mCherry-CTDRemA. CTD, C-terminal T9SS-targeting domain.
c-f,h, Pulse-chase analysis of the export of the SSRemA-mCherry-CTDRemA fusion protein from F. johnsoniae. Cells were labelled with [35S]methionine for 30 min, chased with cold methionine for 0 to 3 h (as indicated), and then separated into cell and supernatant (culture medium) fractions. Fusion protein was enriched by anti-mCherry immunoprecipitation and then analysed by SDS-PAGE and autoradiography. The successively processed forms of the fusion protein are marked using the cartoon representations from b. Trace amounts of free mCherry at t=0 h is background likely due to proteolytic clipping during sample workup. Similar data were obtained for two biological repeats. Export of the fusion protein in wild-type (WT) cells (panel c) was blocked by treatment with the protonophore carbonyl cyanide m-chlorophenyl hydrazone (CCCP, panel f) but not by the ATP synthase inhibitor arsenate (panel, h). Control experiments confirm that the observed export of the mCherry fusion requires the T9SS (ΔsprA strain Fl_00420, panel d) and a functional CTD (poorly-functional K1432A CTD19, panel e). Note, that transport of the fusion across the cytoplasmic membrane by the Sec apparatus is also inhibited by CCCP (panel f) in agreement with previous observations in Escherichia coli 21. The trace transport at 3 h observed in (f) is eliminated by increasing the CCCP concentration to 50μM CCCP. This concentration of protonophore was not used here as it has significant effects on cellular ATP levels. g, Measurements of whole cell ATP levels confirm that the effects of CCCP on protein transport are not an indirect effect of decreased cellular ATP. Bioluminescence measurements of ATP levels from treated cells were normalised to those of untreated cells from the same starting culture. CCCP and arsenate concentrations were as in panels f and h. Error bars represent 1 SD (10 biological repeats) about the mean. The datasets were tested for normality using the Shapiro-Wilk test and also inspected visually using Q-Q plots. The Bartlett test was used to establish that the variances of the two datasets were likely homogeneous. An independent two-tailed t-test indicated that the ATP levels in CCCP- and arsenate-treated cells were not significantly different (n.s.; t-value = -1.9619, df = 17.994, p-value = 0.06543>0.05) even though only CCCP treatment blocks T9SS protein export.

