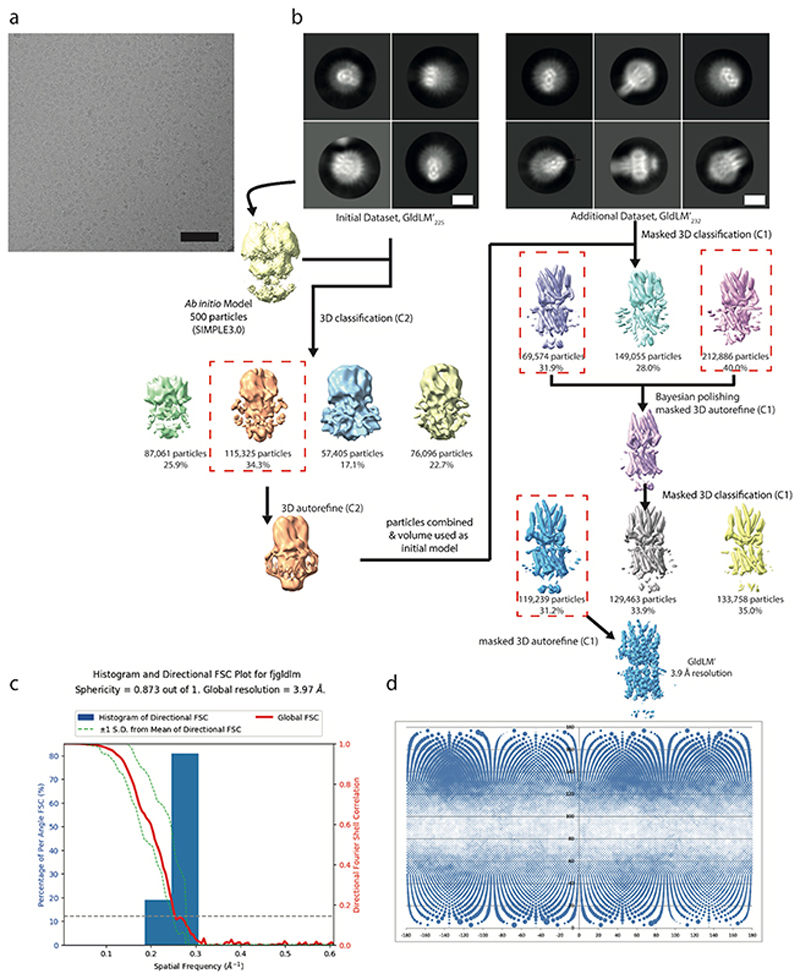
Extended Data Fig. 2. Cryo-EM workflow for GldLM′.
a, Exemplar micrograph collected at a defocus value of approximately -2.5 μm, Scale bar is 200 Å.
b, Image processing workflow for GldLM’. Scale bar is 100 Å.
c, Directional Fourier Shell Correlation (FSC) plot for GldLM′ calculated using the 3DFSC server52.
d, Particle Orientation Distributions from final refined volume. Rotation (phi) is plotted along the x axis and tilt (theta) on the y axis. The area of the dot at the angular position is proportional to the number of particles assigned to that view.

