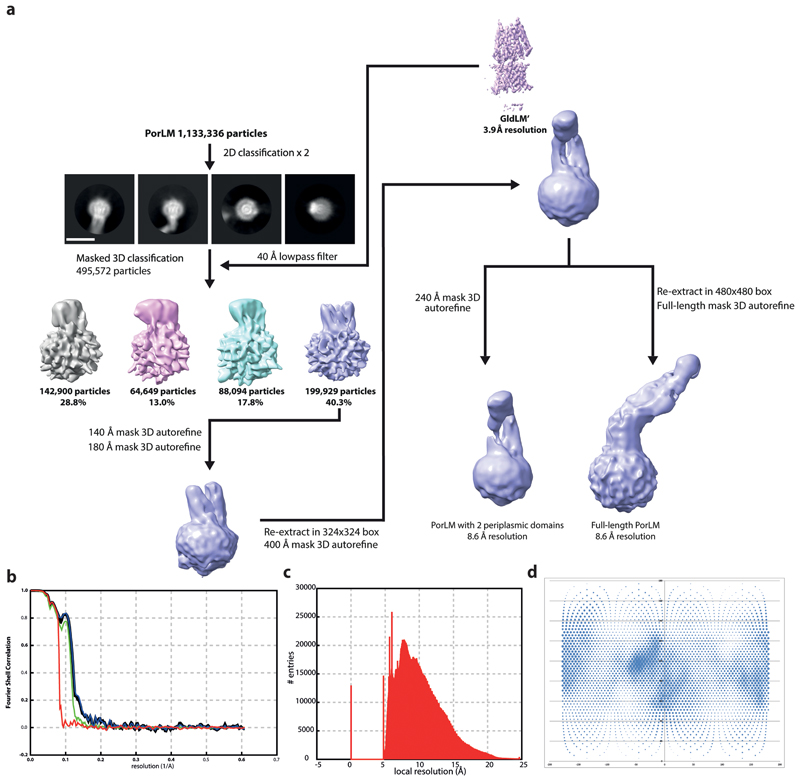
Extended Data Fig. 3. Cryo-EM workflow for PorLM.
a, Image processing workflow for PorLM. Scale bar is 100 Å.
b, Fourier Shell Correlation (FSC) plot for PorLM Red, phase randomised; Green, unmasked; Blue, masked; Black, corrected.
c, Local resolution histogram of PorLM volume
d, Particle Orientation Distributions from final refined volume. Rotation (phi) is plotted along the x axis and tilt (theta) on the y axis. The area of the dot at the angular position is proportional to the number of particles assigned to that view.

